
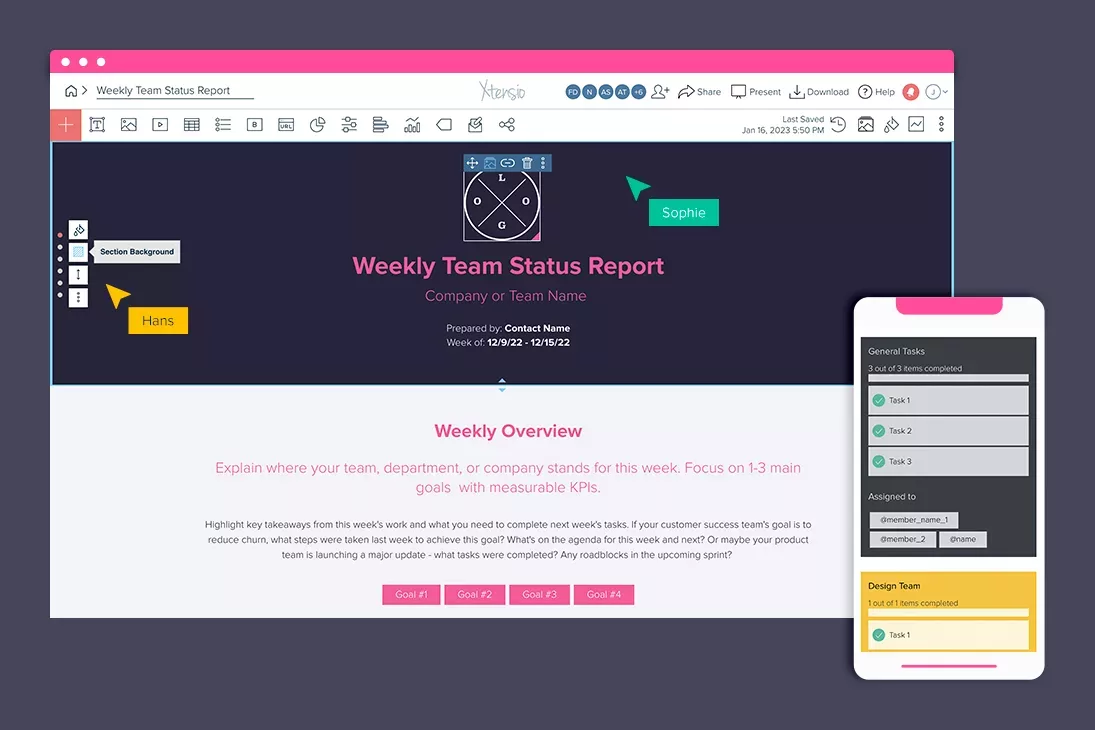
Monthly Performance Report Template
The monthly performance report template helps you communicate achievements, inform management on key decisions and also challenge strategic assumptions. The goal of this exercise is to have each member of your team complete the report on a monthly basis to keep an ongoing record of performance and to analyze and improve the team’s workflow.
- Monitor business performance indicators for any business function (e.g. operations, sales, finance, product, etc.)
- Analyze your team’s efficiency and achievements and set realistic performance goals.
- Understand the weaknesses to establish improvement priorities.
Xtensio is your team space for beautiful living documents.
Create, manage and share business collateral, easily.
Join the 246,279 changemakers.
Xtensio is your team space for beautiful living documents.
Create, manage and share business collateral, easily.
Join the 246,279 changemakers.
- Monitor business performance indicators for any business function (e.g. operations, sales, finance, product, etc.)
- Analyze your team’s efficiency and achievements and set realistic performance goals.
- Understand the weaknesses to establish improvement priorities.
- Use the Annual Report Template to consolidate your monthly findings. Learn how to create an annual report.
How to create a performance report with Xtensio
- Click and start editing, no account or credit card required.
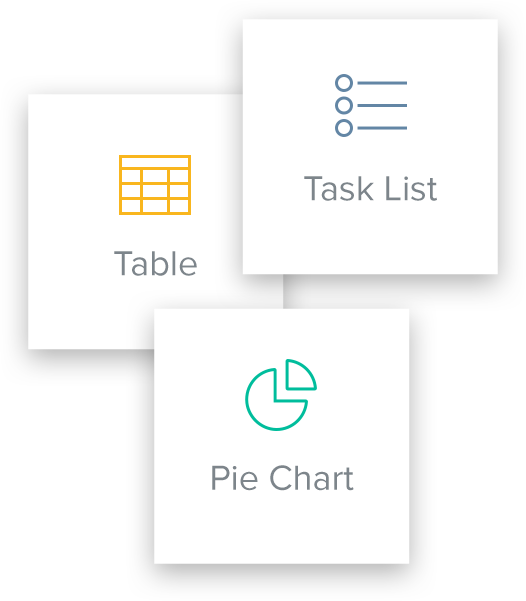
Follow along with the instructional report details. Add charts, graphs, images, and videos to customize the performance report template and make it your own. Drag & drop. Resize. It’s the easiest editor ever.
- Customize everything in the performance report template to match your brand.
Define your style guide. Add your (or your client’s) brand fonts and colors. You can even pull colors directly from a website to easily brand your monthly performance reports and more.
- Work on your performance reports together on the cloud.
Add colleagues (or clients) to collaborate on the performance report template. Changes automatically save and sync across all devices, in real-time.
- Share a link. Present a slideshow. Embed. Download a PDF/PNG.
The report template seamlessly adapts to your workflow. No more jumping from tool-to-tool to design different types of deliverables.
- Reuse and repurpose.
Save your own custom monthly performance report templates. Or copy and merge into other documents.
What is a performance report?
An employee performance report gives managers and executive staff a clear and accurate image of a company’s performance in relation to a given job, project, or objective. Managers can use the performance report to assess current performance levels, create realistic performance targets, and identify shortcomings in order to implement improvement techniques. This exercise is very valuable during performance reviews, whether they are done monthly, quarterly, or annually.
How do I write a monthly performance report?
You will present your performance reports to your organization’s senior management. Put yourself in your manager’s shoes and ask yourself, “What does my supervisor want to see in this report?” “How would the report assist me in evaluating my performance as an employee?”
Here are a few tips for presenting important information in your performance reports:
- Keep your audience in mind; your manager will be evaluating your performance based on job description and goals.
- Address core topics: your achievements related to your specific job description and goals.
- Use concise, measurable and assertive language to explain what you’ve accomplished with measurable KPIs.
Related to the Monthly Performance Report Template
Fully customizable templates that you can make your own.
See how Xtensio can help your business

Build and launch products and services successfully.

Engage buyers more and close sales faster.


Teams use Xtensio to craft and share beautiful living documents.
246,279 users and counting.


Jerome Katz
Professor of Entrepreneurship @

Jake Peters
CEO @

Robin Bramman
Founder and Chief Brand Mixologist @

Olakunle Oladehin
Executive Director @

Aaron Friedland
Executive Director @

Robin Eyre
Owner @

Adam Sher
CEO @

Stephen Paterson
Chief Product Officer @
Frequently asked questions
What is Xtensio?
Xtensio is the quickest and easiest way for teams to create, share and manage all of their business documents together. Create pitches, sales sheets, reports, case studies, agendas and more. Add images, videos, tables, buttons and other interactive modules. Drag and drop, resize, change backgrounds, colors. Share a link. Present a digital slideshow. Export a PDF/PNG.
Do I need to download software?
Nope. Xtensio is a web browser-based platform.
How is Xtensio different from PPT, Illustrator or Word?
Unlike other presentation or document creators, Xtensio works like a web builder so you can easily drag and drop interactive content, customize the layout, and change colors, fonts, backgrounds to get professional-looking business content out the door quickly, without needing a designer.
You can collaborate with team members and guests to work together in real-time on the cloud. And the flexibility to share folios as live web links, digital slideshow presentations or exportable PDF/PNGs means you don’t have to jump between tools when creating different deliverables. Check out this page to see how Xtensio outpaces the competition.
What is a folio?
An Xtensio folio is a unique online page editor. A living document. It’s a live webpage, a full-screen digital slideshow presentation, and an exportable PDF/PNG document all in one. Folios are responsive, collaborative, and completely customizable. Start with an instructional template or a blank folio to build all your business documents and presentations with the ease of a web builder. Add team members and guests to work together in real time on the cloud. Changes instantly sync to the live version of the folio so both internal and external stakeholders are always up-to-date. Xtensio folios are the next generation of flexible documents and presentations.
Is my data private and secure?
Yes. All Xtensio plans include 128 bit SSL encryption and backups to ensure your data is secure. Here’s more on the range of sharing options on Xtensio, from completely private to public.
Can I create a free performance report?
Yes. Any Xtensio template is FREE TO TRY. No need to add your credit card information to start editing. Create an account if you would like to save and share your work.
What would I get by upgrading to a premium plan?
By upgrading to our premium plans, you’ll have a private, branded workspace with your own URL where you, your team members and guests can create and collaborate on multiple presentations and documents.
You’ll be able to lock branding across your deliverables with the team style guide, streamline the creation process with custom templates, unlock exports, add password protection and customize individual shared links, and view project stats to stay updated on all of your projects. Here’s more about our premium plans.
What would I use the performance report template for?
The performance report helps analyze your team’s efficiency and achievements and make adjustments to your workflow. The goal of this exercise is to have each member of your team complete the report on a monthly basis to keep an ongoing record of performance, analyze and improve the team’s workflow.
What should be included in a monthly report?
You should include any and all details about the tasks and projects you’ve worked on throughout the past month. Include any important details, roadblocks, questions or concerns.
What is a living document?
The living monthly performance report template allows you to instantly sync with your team, different departments and management. You can add collaborators to work in real-time. And you can share the customizable link to keep colleagues up-to-date on your progress.
Can I add colleagues to edit the performance report?
Choose your file format. Present it as a full-screen digital slideshow, share it as a responsive web link or export it as a PDF (customize the PDF size) or PNG.
Do you have other tools for project management?
We do! There are a number of different templates, examples and resources to guide you through defining and implementing your business. Check out our Project Management toolbox and our Strategy toolbox to find more tools and resources.

Teamspace for beautiful living documents.


246,279 users and counting…