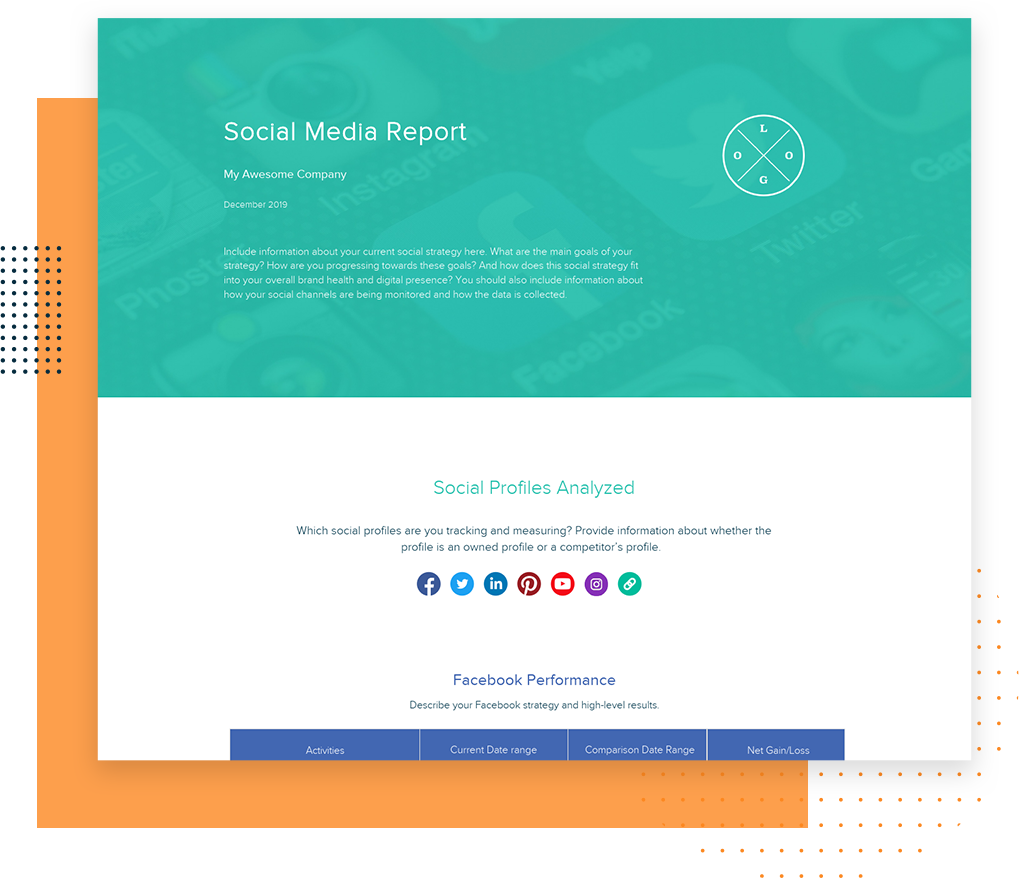
Social Media Report Template
The social media report is key to proving the value of your social marketing plan. Use the template to outline and analyze concrete data. This exercise will show what you’ve accomplished and help guide your social marketing strategy. This is a process that your team should continually evaluate and optimize.
- Create a visually smart, simple and easy-to-understand social media report.
- Keep track of your growth and improve your social strategy.
- Prove the value and ROI of your social media campaigns.
- Monitor your social channels and to see what works and what doesn’t so you can improve, repeat and delete.
Xtensio is your team’s deliverables workspace.
Create, collaborate, and deliver client-ready docs—then keep them current.
Join 409,446 using Xtensio.
Xtensio is the workspace for professional deliverables.
Make one deliverable today—then build a repeatable system for every client and project.
This is where teams create, collaborate, organize, and deliver the documents that run their work.
Everything stays on-brand, current, and ready to share.

Organize every deliverable
Keep strategy, sales, marketing, and client docs together by workspace.
Create fast, stay consistent
Start from 200+ templates or AI drafts, then apply your brand kit.
Collaborate in the doc
No more “final_v7.pdf” loop.
Standardize across deliverables
Apply your brand kit + reusable modules so every deliverable matches.
Improve what you send
See engagement, iterate, and reuse what works across projects.
How to create a social media report with Xtensio
- Create a free account and start editing, no credit card required.
Follow along with the instructional social media report details. Add charts, graphs, images, and videos to customize the report template and make it your own. Drag & drop. Resize. Customize the report format however you need. It’s the easiest editor ever.
- Customize everything in the social media report template to match your brand.
Define your style guide. Add your (or your client’s) brand fonts and colors. You can even pull colors directly from a website to easily brand your social media reports and more.
- Work on your social media analytics together on the cloud.
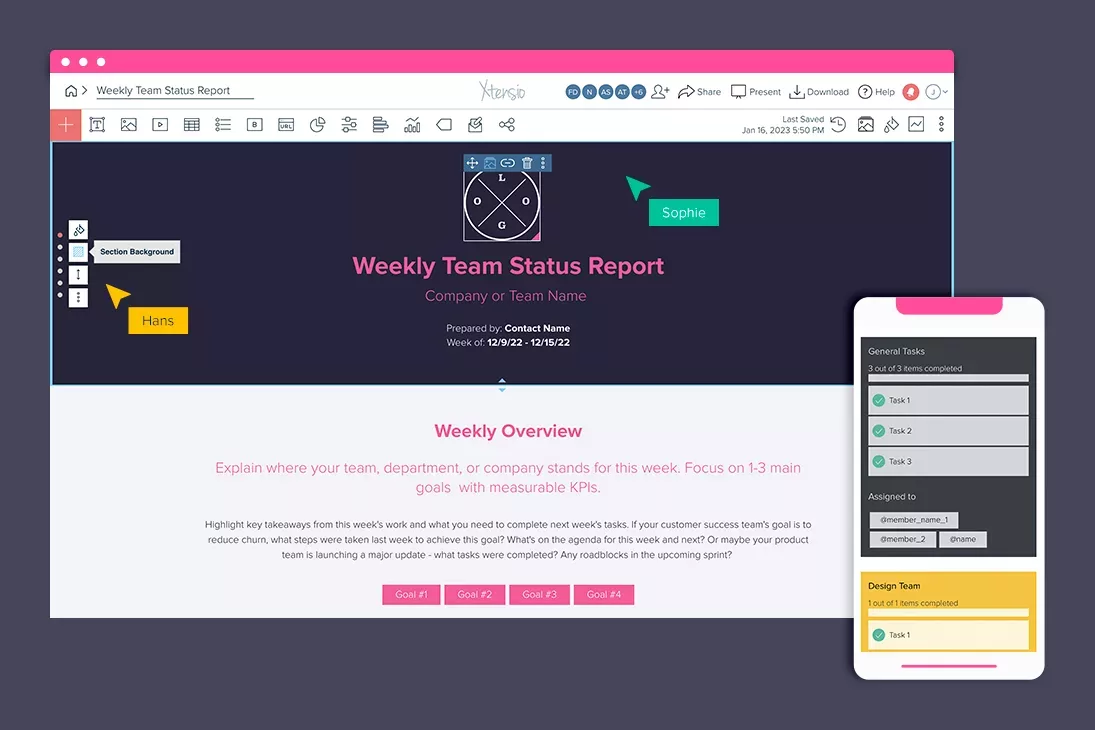
Add colleagues (or clients) to collaborate on the social media report template. Changes automatically save and sync across all devices, in real-time.
- Share a link. Present a slideshow. Embed. Download a PDF/PNG.
The social media report seamlessly adapts to your workflow. No more jumping from tool-to-tool to design different types of deliverables.
- Reuse and repurpose.
Save your own custom social media reporting template. Or copy and merge into other documents.

What is a social media report template?
Social media is a fundamental element of any digital marketing strategy. Tracking your performance on your social networks with the social media report template allows you to outline and analyze concrete social media metrics . This will help you understand what’s driving clicks, what’s bringing engagement and growing followers, etc.
What should be included in a social media report?
You’ll want to dig into the data for each social media platform (Facebook, Twitter, Instagram, Pinterest, LinkedIn, etc.) you’re posting on to get an overview of your social media strategy as a whole. Keep in mind that data can be both extremely insightful and overwhelmingly confusing. Track metrics that will help you learn and improve.
Here are some metrics you may want to consider:
- Content – How many posts, how often, how successful.
- Leads – Visitors who may become customers.
- Conversions – Leads that become paying customers.
- Reach and impressions – People who saw your posts.
- Volume – Conversion size and brand mentions.
- Engagement – Clicks, comments, shares.
- Audience – Location, gender, language, interests, occupation, age.
- Follower and audience growth – How many new followers are each of your social channels getting each month?
- Click-through with bounce rate – Website visitors and how long they stay.
- Mentions – How much are consumers talking about you?
- Insights – Product feedback, user-generated content, technical issues.
- Summary – An overview of the top social achievements.
Social Media Report vs Analytics Dashboard vs Performance Review
These three documents serve different audiences and different purposes. Using the wrong format for the wrong audience is one of the most common social media reporting mistakes.
A social media report is a narrative document. It tells the story behind the numbers: what happened, why it happened, and what the team should do next. Reports are built for stakeholders who need context, not just data points. A good report turns raw metrics into insights that inform budget decisions, content strategy, and campaign direction. Reports are typically shared monthly or quarterly.
An analytics dashboard is a real-time monitoring tool. It shows current metrics across channels in one view. Dashboards are for the team members managing daily social activity. They answer “what is happening right now” but not “what does it mean.” If your team only uses dashboards, they have data without direction.
A performance review is a strategic assessment. It zooms out from individual campaigns to evaluate overall social media effectiveness against business objectives. Reviews happen quarterly or annually and inform high-level decisions: Should we invest more in paid social? Should we abandon a channel? Is our social strategy aligned with company goals?
Most teams need all three. The dashboard for daily operations, the report for stakeholder communication, and the review for strategic planning. Pair your social media report with a content calendar to connect reporting insights directly to content planning.
5 Social Media Report Mistakes
Even experienced marketers fall into these reporting traps. Each one reduces the report’s value and makes it harder to justify social media investment to leadership.
1. Reporting vanity metrics without context. Follower counts and total impressions look impressive in isolation but tell you nothing about business impact. A report showing “we gained 500 followers this month” is meaningless without context: Where did they come from? Are they in our target audience? Did any convert? Always tie top-of-funnel metrics to downstream actions.
2. Missing benchmarks and comparisons. Numbers without reference points are noise. Is a 2.3% engagement rate good or bad? It depends on your industry, your channel, and your historical average. Every metric in your report should sit next to at least one benchmark: last month, last quarter, or industry average. Without benchmarks, stakeholders cannot evaluate performance.
3. Ignoring qualitative insights. The best social media reports go beyond numbers. What were the top comments? What sentiment patterns emerged? Did any post generate unexpected conversation? Qualitative data reveals why metrics moved in a particular direction. A post that generated 50 comments of genuine product feedback is more valuable than one that got 500 likes from a giveaway.
4. No recommendations or next steps. A report that ends with data is a missed opportunity. Every social media report should include 3-5 specific recommendations based on the data. “Instagram Reels outperformed static posts by 3x this month. Recommendation: shift 30% of static post budget to Reels next month.” Reports that drive action earn continued investment.
5. Inconsistent reporting periods and formats. When each month’s report uses different metrics, different time windows, or different visualizations, trends become invisible. Standardize your report structure and stick with it. Use engagement analytics to track how stakeholders interact with your reports, and refine the format based on which sections they actually read.
How to Structure Social Media Reports by Audience
The same data told three different ways serves three different audiences. Here is how to structure your report based on who is reading it.
For C-suite and executives: lead with business impact. Executives do not care about engagement rates. They care about revenue, leads, and brand awareness tied to business goals. Structure the report around: (1) social media’s contribution to pipeline or sales, (2) cost per lead by channel, (3) brand sentiment trends, (4) competitive positioning. Keep it to one page. Use charts, not paragraphs. Include one clear recommendation with a dollar amount attached.
For marketing managers: lead with channel performance. Marketing managers need operational detail. Structure the report around: (1) channel-by-channel performance with period-over-period comparison, (2) top-performing content with analysis of why it worked, (3) underperforming content with hypotheses, (4) audience growth and composition changes, (5) budget utilization and cost efficiency. Include enough detail for them to brief their teams and adjust the content calendar.
For clients: lead with campaign results. Clients want to know their investment is working. Structure the report around: (1) campaign objectives and whether they were met, (2) key wins with specific examples, (3) what you learned and how it informs next month’s strategy, (4) next steps with clear timelines. Keep the tone conversational and avoid jargon. When your report lives as a live link, clients can check progress anytime rather than waiting for the monthly email. Store all client reports in a shared workspace so nothing gets lost in inboxes.
The strongest social media reports are living deliverables that evolve with your strategy. They stay current as campaigns launch and conclude, they adapt to each audience’s needs, and they turn raw data into decisions that improve next month’s results.
Related to the Social Media Report Template
Fully customizable templates that you can make your own.
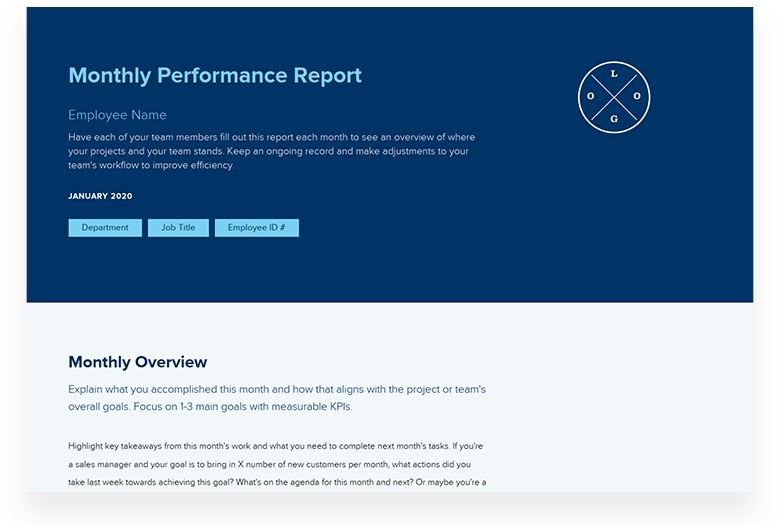
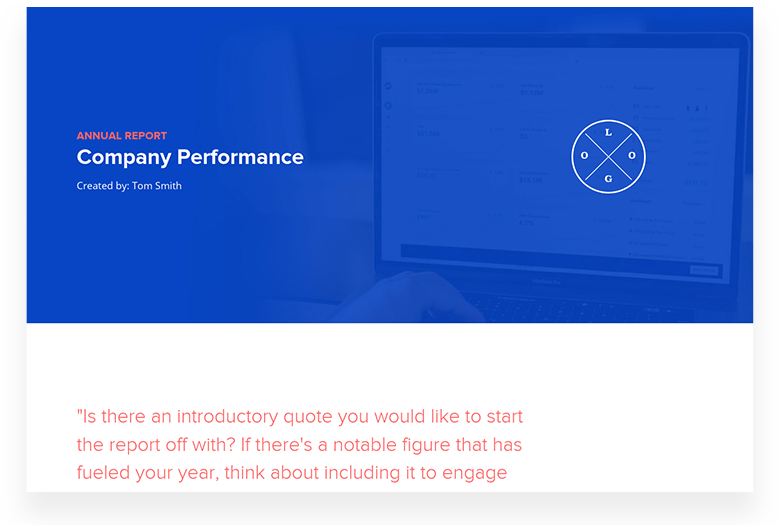
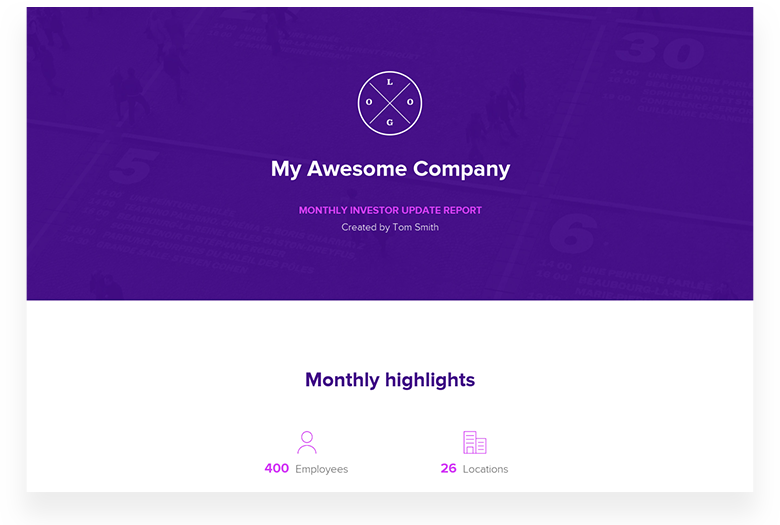

Jerome Katz
Professor of Entrepreneurship @

Jake Peters
CEO @

Robin Bramman
Founder and Chief Brand Mixologist @

Olakunle Oladehin
Executive Director @
Everybody Dance Now!

Aaron Friedland
Executive Director @
The Walking School Bus

Robin Eyre
Owner @

Adam Sher
CEO @

Stephen Paterson
Chief Product Officer @

Create and deliver beautiful work, professionally.
Build, brand, and deliver living documents your clients actually engage with.







Join 409,446 professionals delivering work with Xtensio.
Related reports: Monthly Marketing Report Template, Weekly Project Status Report Template