How To Create A Social Media Report
Updated by Xtensio
The social media report is key to proving the value of your social marketing plan. This exercise will show what you’ve accomplished and help guide your social marketing strategy. Use this step-by-step guide to create and iterate on your social media reports, easily. Explore this template.
Xtensio is your team space for beautiful living documents.
Create, manage and share business collateral, easily.
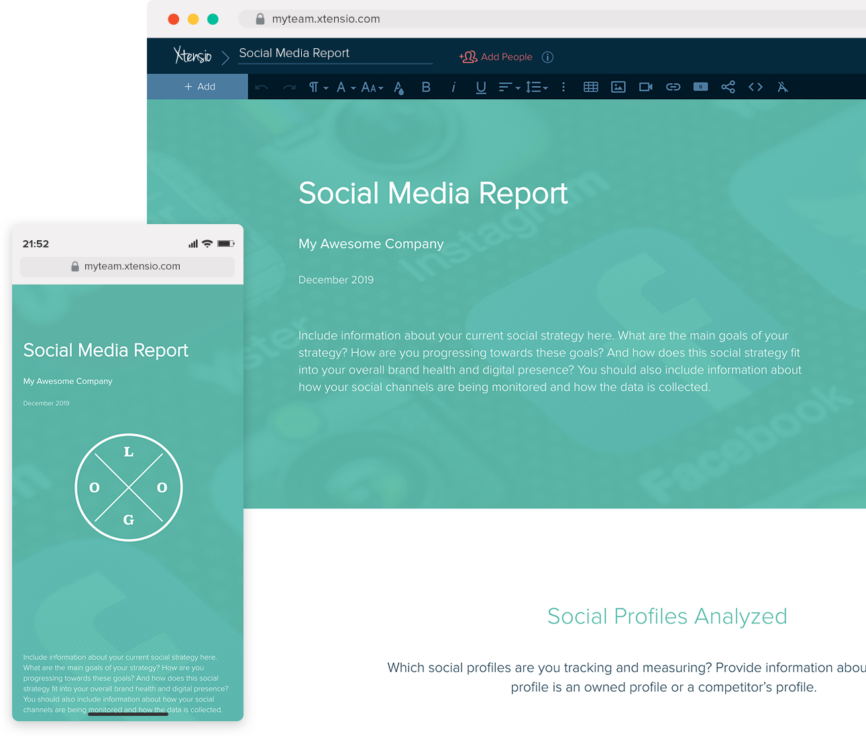
Table of Contents
What Is a Social Media Report
A social media report is a structured document that presents your social media performance data over a specific time period — typically monthly or quarterly. It translates raw metrics into insights that inform strategy, justify budget, and demonstrate ROI to stakeholders who may not live inside social platforms daily.
The audience determines the format. A report for your social media team can dive deep into post-level performance and content experiments. A report for the CMO should focus on channel-level trends, campaign results, and their connection to broader marketing goals.
Every report should answer four questions: How did we perform against our goals? What content resonated most (and why)? What should we do differently next month? What resources or support do we need? If your report answers all four, stakeholders have everything they need to make decisions.
Share the report as a live link rather than a static PDF. This ensures everyone sees the same version, and you can update the report if data corrections are needed after the initial send.
Key Metrics for Every Social Media Report
Reach and impressions show how many people saw your content. Reach counts unique viewers; impressions count total views (including repeat). Tracking both helps you understand whether you are expanding your audience (reach) or creating content worth returning to (high impressions-to-reach ratio).
Engagement rate is the percentage of people who interacted with your content — likes, comments, shares, saves, clicks. It is more meaningful than raw engagement counts because it adjusts for audience size. A post with 50 likes from 500 followers (10% engagement) performed better than one with 200 likes from 50,000 followers (0.4%).
Click-through rate (CTR) and conversion rate connect social activity to business outcomes. CTR shows how often viewers clicked your links; conversion rate shows how often those clicks led to a desired action (signup, download, purchase). These metrics justify social’s contribution to the funnel.
Follower growth rate, share of voice (how much of the conversation your brand owns versus competitors), and cost per result (for paid social) round out the metrics that matter. Choose five to eight metrics aligned with your goals — reporting on twenty metrics dilutes the signal.
How to Present Social Data to Non-Marketing Stakeholders
Executives and cross-functional partners do not think in engagement rates and impressions. Translate social metrics into business language. Instead of ‘we got 15,000 impressions on our product launch post,’ say ‘our product launch announcement reached 15,000 potential customers organically, generating 340 website visits and 28 demo requests.’
Lead with outcomes, not activities. Stakeholders do not care how many posts you published — they care about what those posts achieved. Structure the executive section of your report around goals and results, not a chronological list of things you did.
Use benchmarks to provide context. Saying your engagement rate is 3.2% means nothing without a reference point. Compare it to your own historical average, industry benchmarks, or competitive estimates. Context turns data into insight.
Keep visuals simple. One chart per metric, clearly labeled, with a one-sentence interpretation underneath. Executives spend about 30 seconds on each section of a report — make those seconds count by eliminating visual clutter.
Social Media Report Frequency: Weekly vs Monthly vs Quarterly
Weekly reports are best for high-activity periods — during a major campaign, product launch, or crisis. They let you adjust tactics in near-real-time. Keep weekly reports short (one page) and focused on the top five metrics that matter most this week.
Monthly reports are the standard for most social teams. A month provides enough data to identify trends, evaluate content themes, and compare against goals. Monthly cadence balances the need for timely insights with the overhead of report preparation.
Quarterly reports are strategic — they step back from month-to-month fluctuations and focus on longer-term trends, audience growth, and platform-level strategy decisions. Use quarterly reports to propose budget changes, new platform investments, or strategy pivots.
Many teams produce all three: a lightweight weekly pulse, a comprehensive monthly report, and a strategic quarterly review. Organize all reports by client or period in your workspace so historical data is always accessible.
Your guide to creating an impactful social media report for your marketing team, clients, and key stakeholders
Social media is a fundamental element of any digital marketing strategy. Tracking your performance on your social networks with the social media report template allows you to outline and analyze concrete social media metrics. This will help you understand what’s driving clicks, what’s bringing engagement and growing followers, etc. This is a process that your team should continually evaluate and optimize.
- Create a visually smart, simple, and easy-to-understand social media report.
- Keep track of your growth and improve your social strategy.
- Prove the value and ROI of your social media campaigns.
- Monitor your social channels to see what works and what doesn’t so you can improve, repeat and delete.
With Xtensio, you can easily generate your social media reports tailored to your (or your client’s) social media marketing objectives. Loop in colleagues, clients, and key stakeholders to create and iterate on your reports. You can work hand-in-hand with colleagues on a live doc, leave feedback, and share a link so everyone is updated on the status of your social media process, KPIs, and objectives.
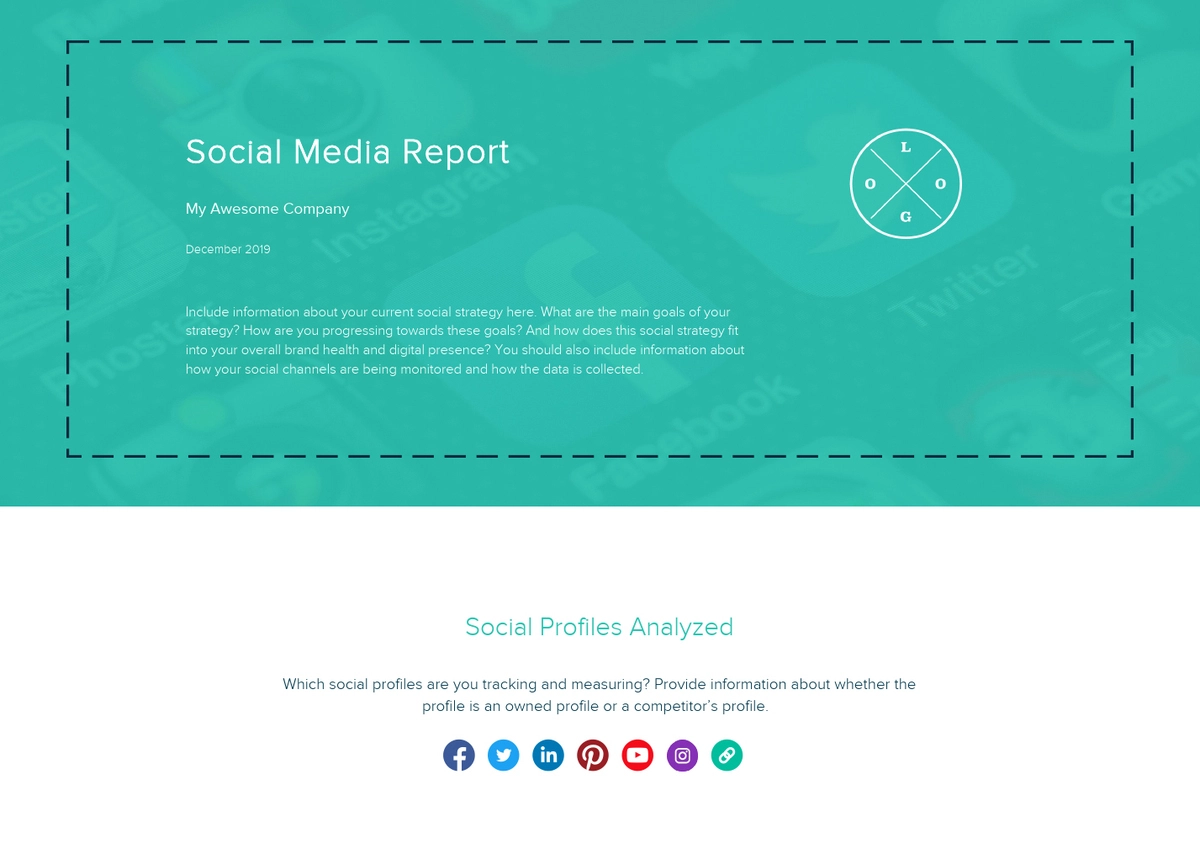
1. Create your social media report header and overview
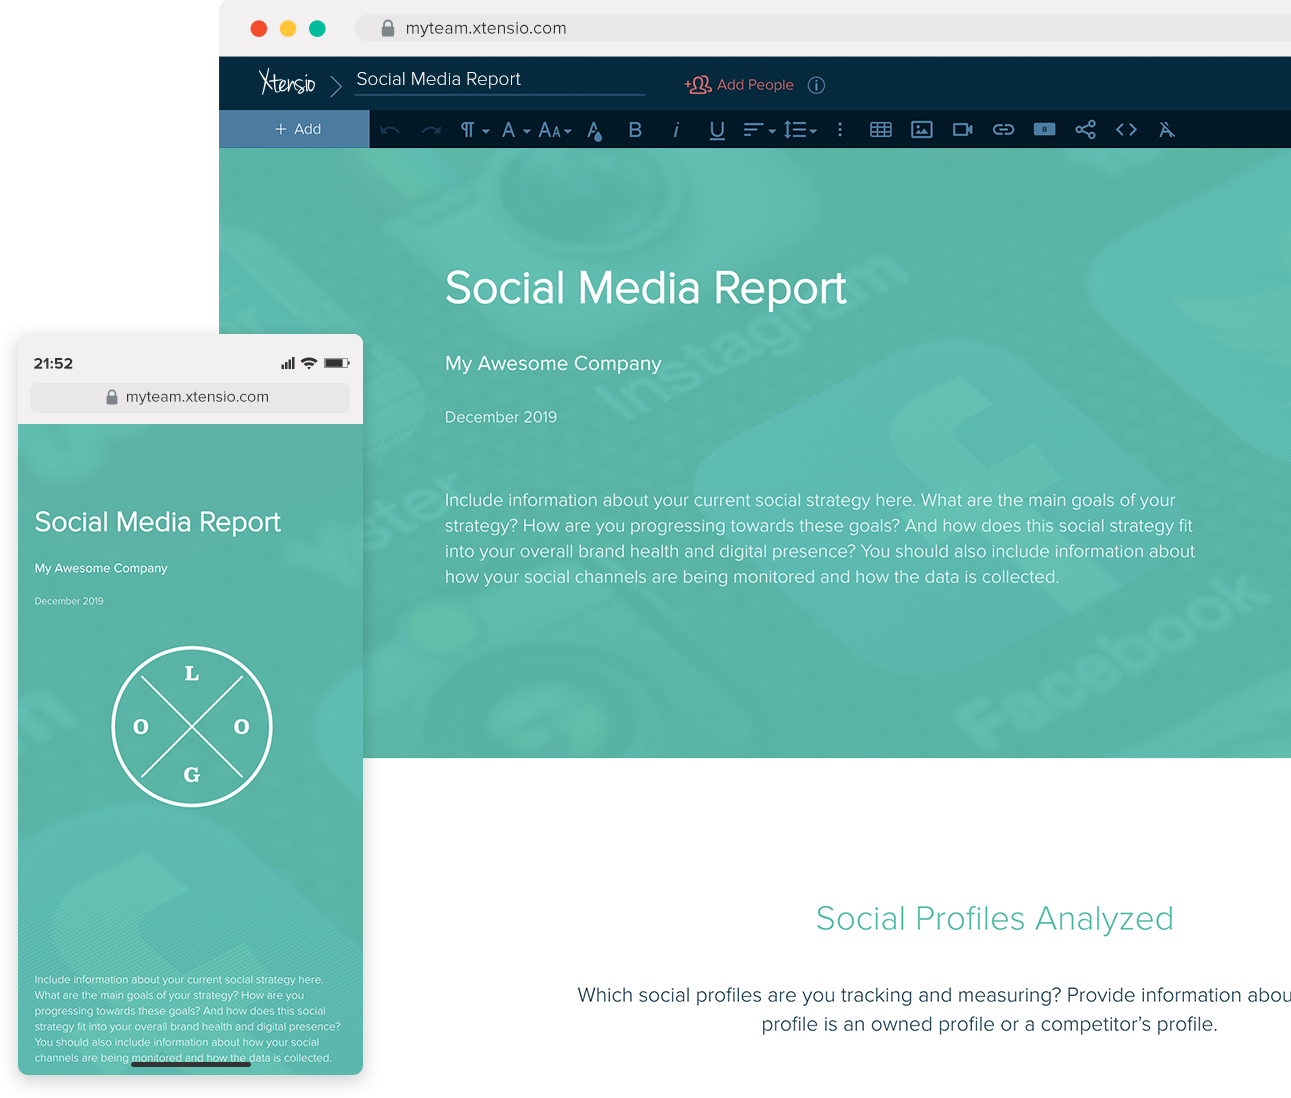
Introduce your social media report with your company or your client’s company name and logo, add the month you’re reporting for, and update the folio color scheme and background to match your company branding.
In the overview section, include information about your current social strategy.
- What are the main goals of your strategy?
- How are you progressing towards these goals?
- And how does this social strategy fit into your overall brand health and digital presence?
You should also include information about how your social channels are being monitored and how the data is collected.
QUICK TIP: Once you set up your header section, you can save a custom template to easily repurpose your ongoing social media reports.
2. Outline what social channels you’re posting to and reporting on
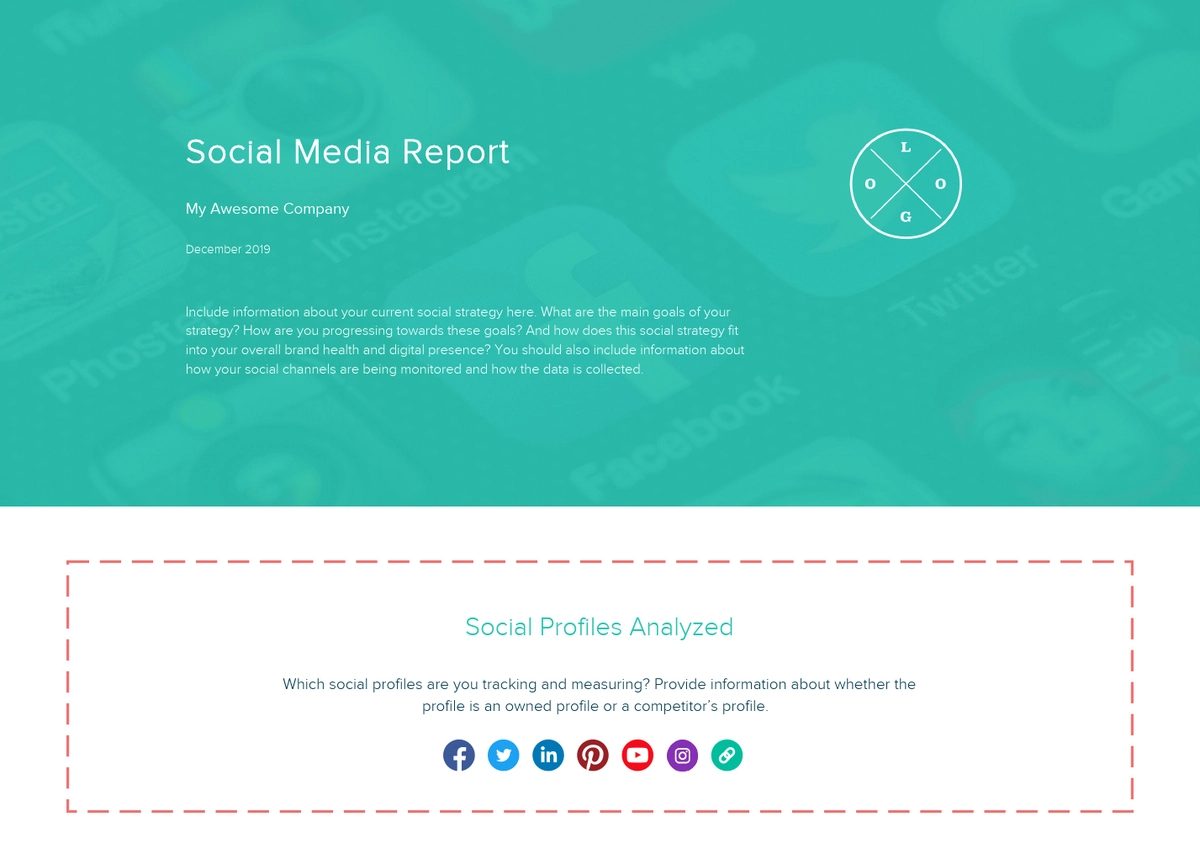
Which social profiles are you tracking and measuring? Provide information about whether the profile is an owned profile or a competitor’s profile. The channels you report on could be:
- Youtube
To gather your data, you can use the individual analytics on each social channel, and you may want to explore other analytics tools such as Google Analytics.
3. Detail the posting and performance for each social channel you’re managing
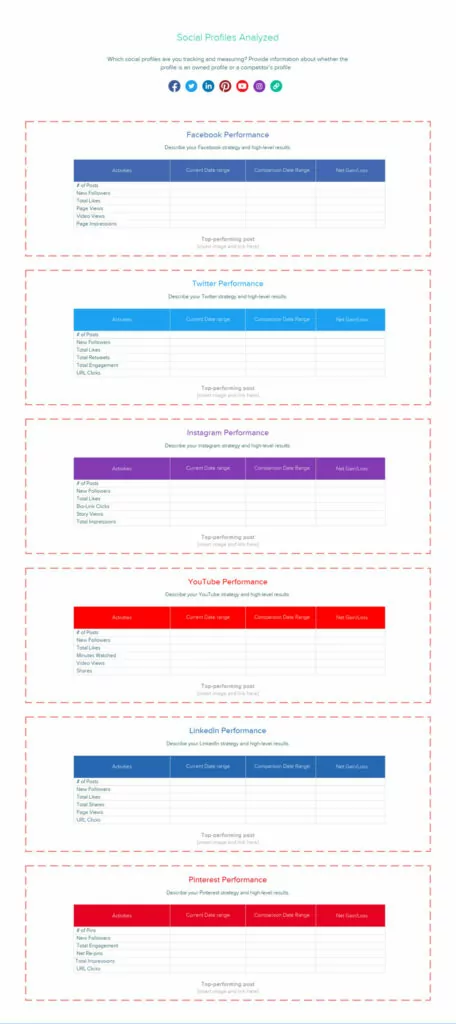
For each channel, create a table to detail posting and performance for the month. Describe your social channel strategy and high-level results.
Which data and stats you share in your report should depend on the specific social media strategies, channels, and goals you’re managing. These could include:
- Leads – Visitors who may become customers.
- Conversions – Leads that become paying customers.
- Reach and impressions – People who saw your posts.
- Audience – Location, gender, language, interests, occupation, age.
- Follower and audience growth – How many new followers are each of your social channels getting each month?
- Click-through with bounce rate – Website visitors and how long they stay.
- Insights – Product feedback, user-generated content, technical issues.
- Summary – An overview of the top social achievements.
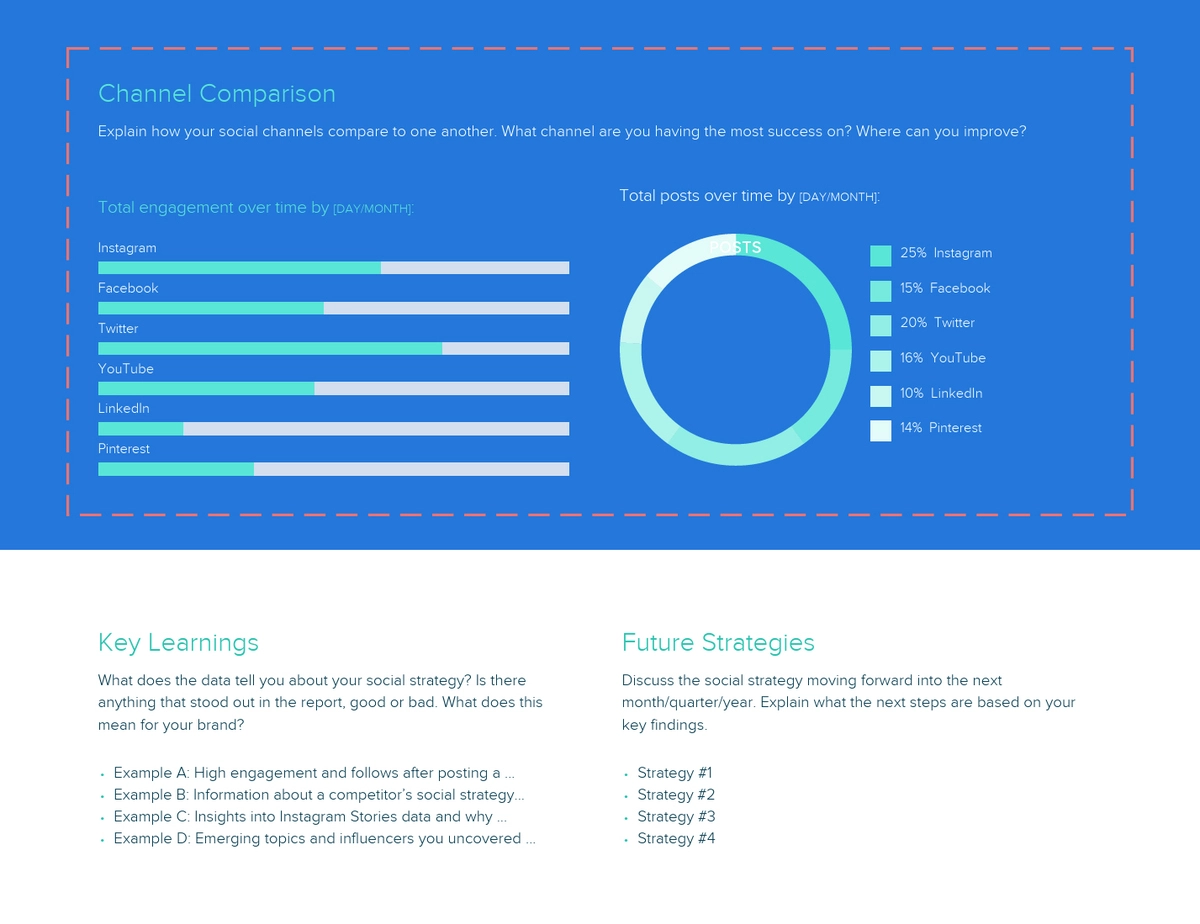
4. Compare the performance of all your social channels
Explain how your social channels compare to one another. What channel are you having the most success on? Where can you improve?
Use charts and graphs to visualize how your social efforts are performing.
5. Summarize key findings and brainstorm future social media strategies
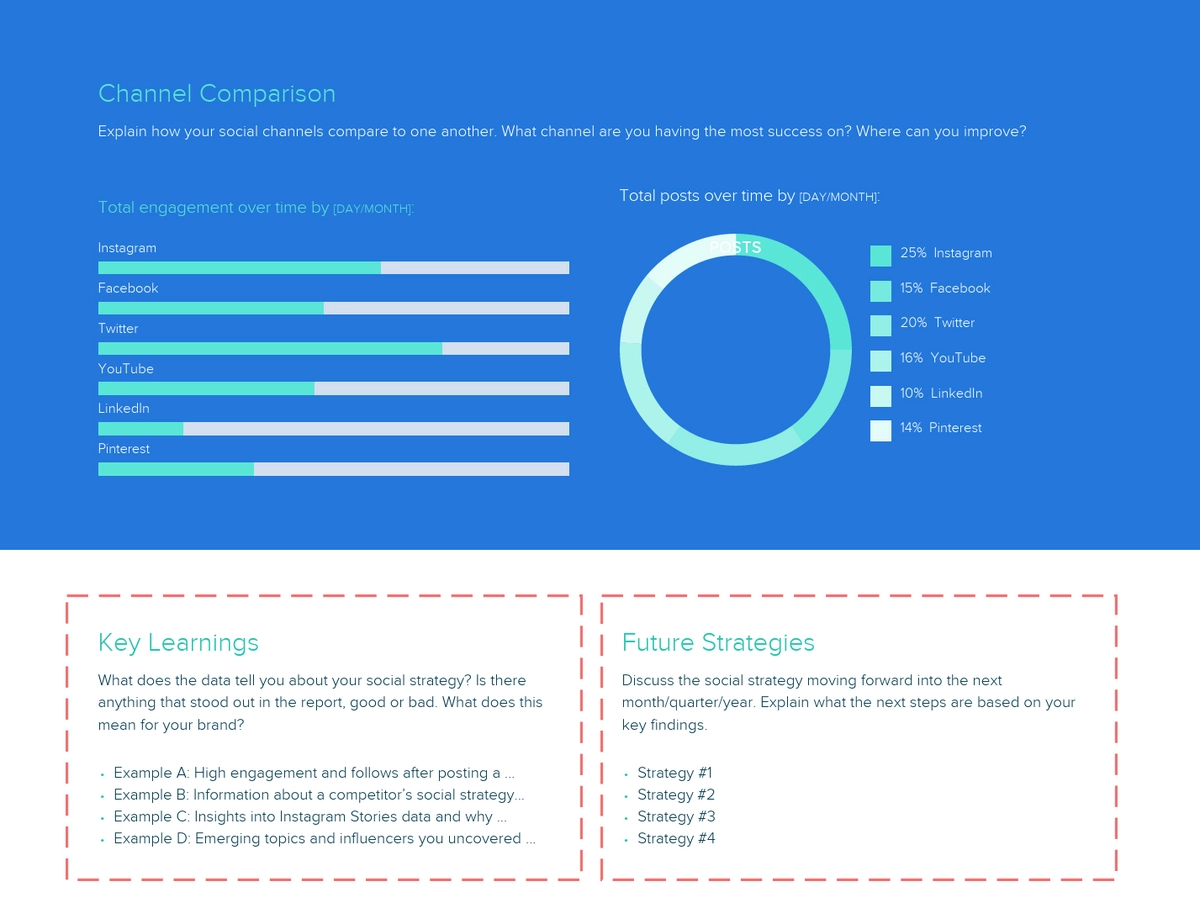
What does the data tell you about your social strategy? Is there anything that stood out in the report, good or bad? What does this mean for your brand?
- Example A: High engagement and follows after posting a …
- Example B: Information about a competitor’s social strategy…
- Example C: Insights into Instagram Stories data and why …
- Example D: Emerging topics and influencers you uncovered …
Discuss the social strategy moving forward into the next month/quarter/year. Explain what the next steps are based on your key findings.
Share your social media report as a link, monitor, evaluate & iterate
When you’ve finished creating your social media report with Xtensio’s editor, you can send the live link to share it as a responsive webpage (and add password protection), export a PDF and post it on your bulletin board and continuously optimize with new learnings. The social media report template is adaptable just like other Xtensio tools, it can and should be repurposed, revisited, and revised regularly.
Written by

Design, manage and share beautiful living documents… easily, together. Explore Xtensio
- Click and edit anything… together.
- Customize to match your branding.
- Share with a link, present, embed or download.

Create and deliver beautiful work, professionally.
Build, brand, and deliver living documents your clients actually engage with.







Join 410,037 professionals delivering work with Xtensio.
Related reports: Annual Report Template, Monthly Performance Report Template
Related reports: Annual Report Template, Monthly Performance Report Template