How to Create an Annual Budget Report (With Template and Examples)
Updated by Xtensio
Creating an annual budget report might sound tricky, but it’s really about getting a clear view of your expenses and cash flow. This helps you understand your financial situation and plan for growth. In this guide, we’ll go through each step, with a handy template and real examples to make things easier. Let’s dive in and tackle this together! Follow along with the free template.
Listen to this article:
Xtensio is your team space for beautiful living documents.
Create, manage and share business collateral, easily.
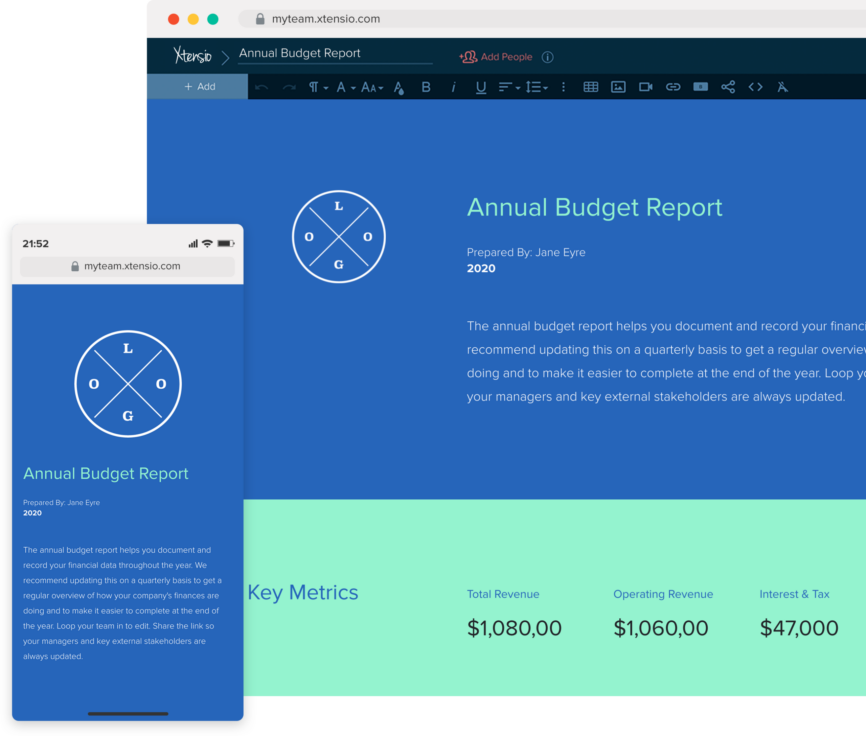
Table Of Contents
Creating an annual budget report is about planning your finances for the year. It serves as a guide to track revenue and expenses. This report outlines expected income—from sales, investments, and loans—and anticipated costs like salaries, operating expenses, debt repayments, and capital expenditures. The goal is to provide a clear view of your financial health, enabling smart decisions and future planning.
A key component is ‘net operating income,’ which is the profit from core operations after operating expenses. This measure shows how well your business performs in its main activities, excluding loans or taxes.
The report often includes a budget variance analysis to compare actual figures to budgeted ones, identifying discrepancies. Contingency funds may also be detailed for unexpected expenses. For assistance, we offer examples and templates to get you started. Ensure your report aligns with your company’s branding, is easy to read, and provides clear insights for all stakeholders.
What Is an Annual Budget Report
An annual budget report is a financial summary that compares your organization’s planned budget against actual spending and revenue for a fiscal year. It shows where money went, where it deviated from projections, and what those deviations mean for the business.
Unlike a profit-and-loss statement, which is an accounting document, a budget report is a management tool. It helps leadership understand whether departments stayed within their allocations, which investments paid off, and where adjustments are needed for the coming year.
The primary audiences are the executive team, the board of directors (if applicable), department heads, and finance. Each audience needs different levels of detail — the CFO wants line-item variance analysis, while the CEO wants a one-page summary of wins, misses, and recommendations.
A well-prepared budget report builds credibility. When you present financials clearly, explain variances honestly, and propose data-backed recommendations, you earn the trust that gets future budgets approved.
Key Components of an Annual Budget Report
Start with an executive summary — a half-page overview of total revenue, total expenses, net position, and the three most significant variances. Executives may not read beyond this section, so make it count.
The revenue section breaks down income by source: product lines, customer segments, geographic regions, or whatever categories are meaningful to your business. Show planned vs actual for each category, with percentage variance and a brief explanation for any deviation greater than 10%.
The expense section should mirror your budget structure — typically by department and expense category (personnel, software, marketing, travel, etc.). Highlight underspend as well as overspend — underspending on a growth initiative may be a bigger concern than overspending on a successful campaign.
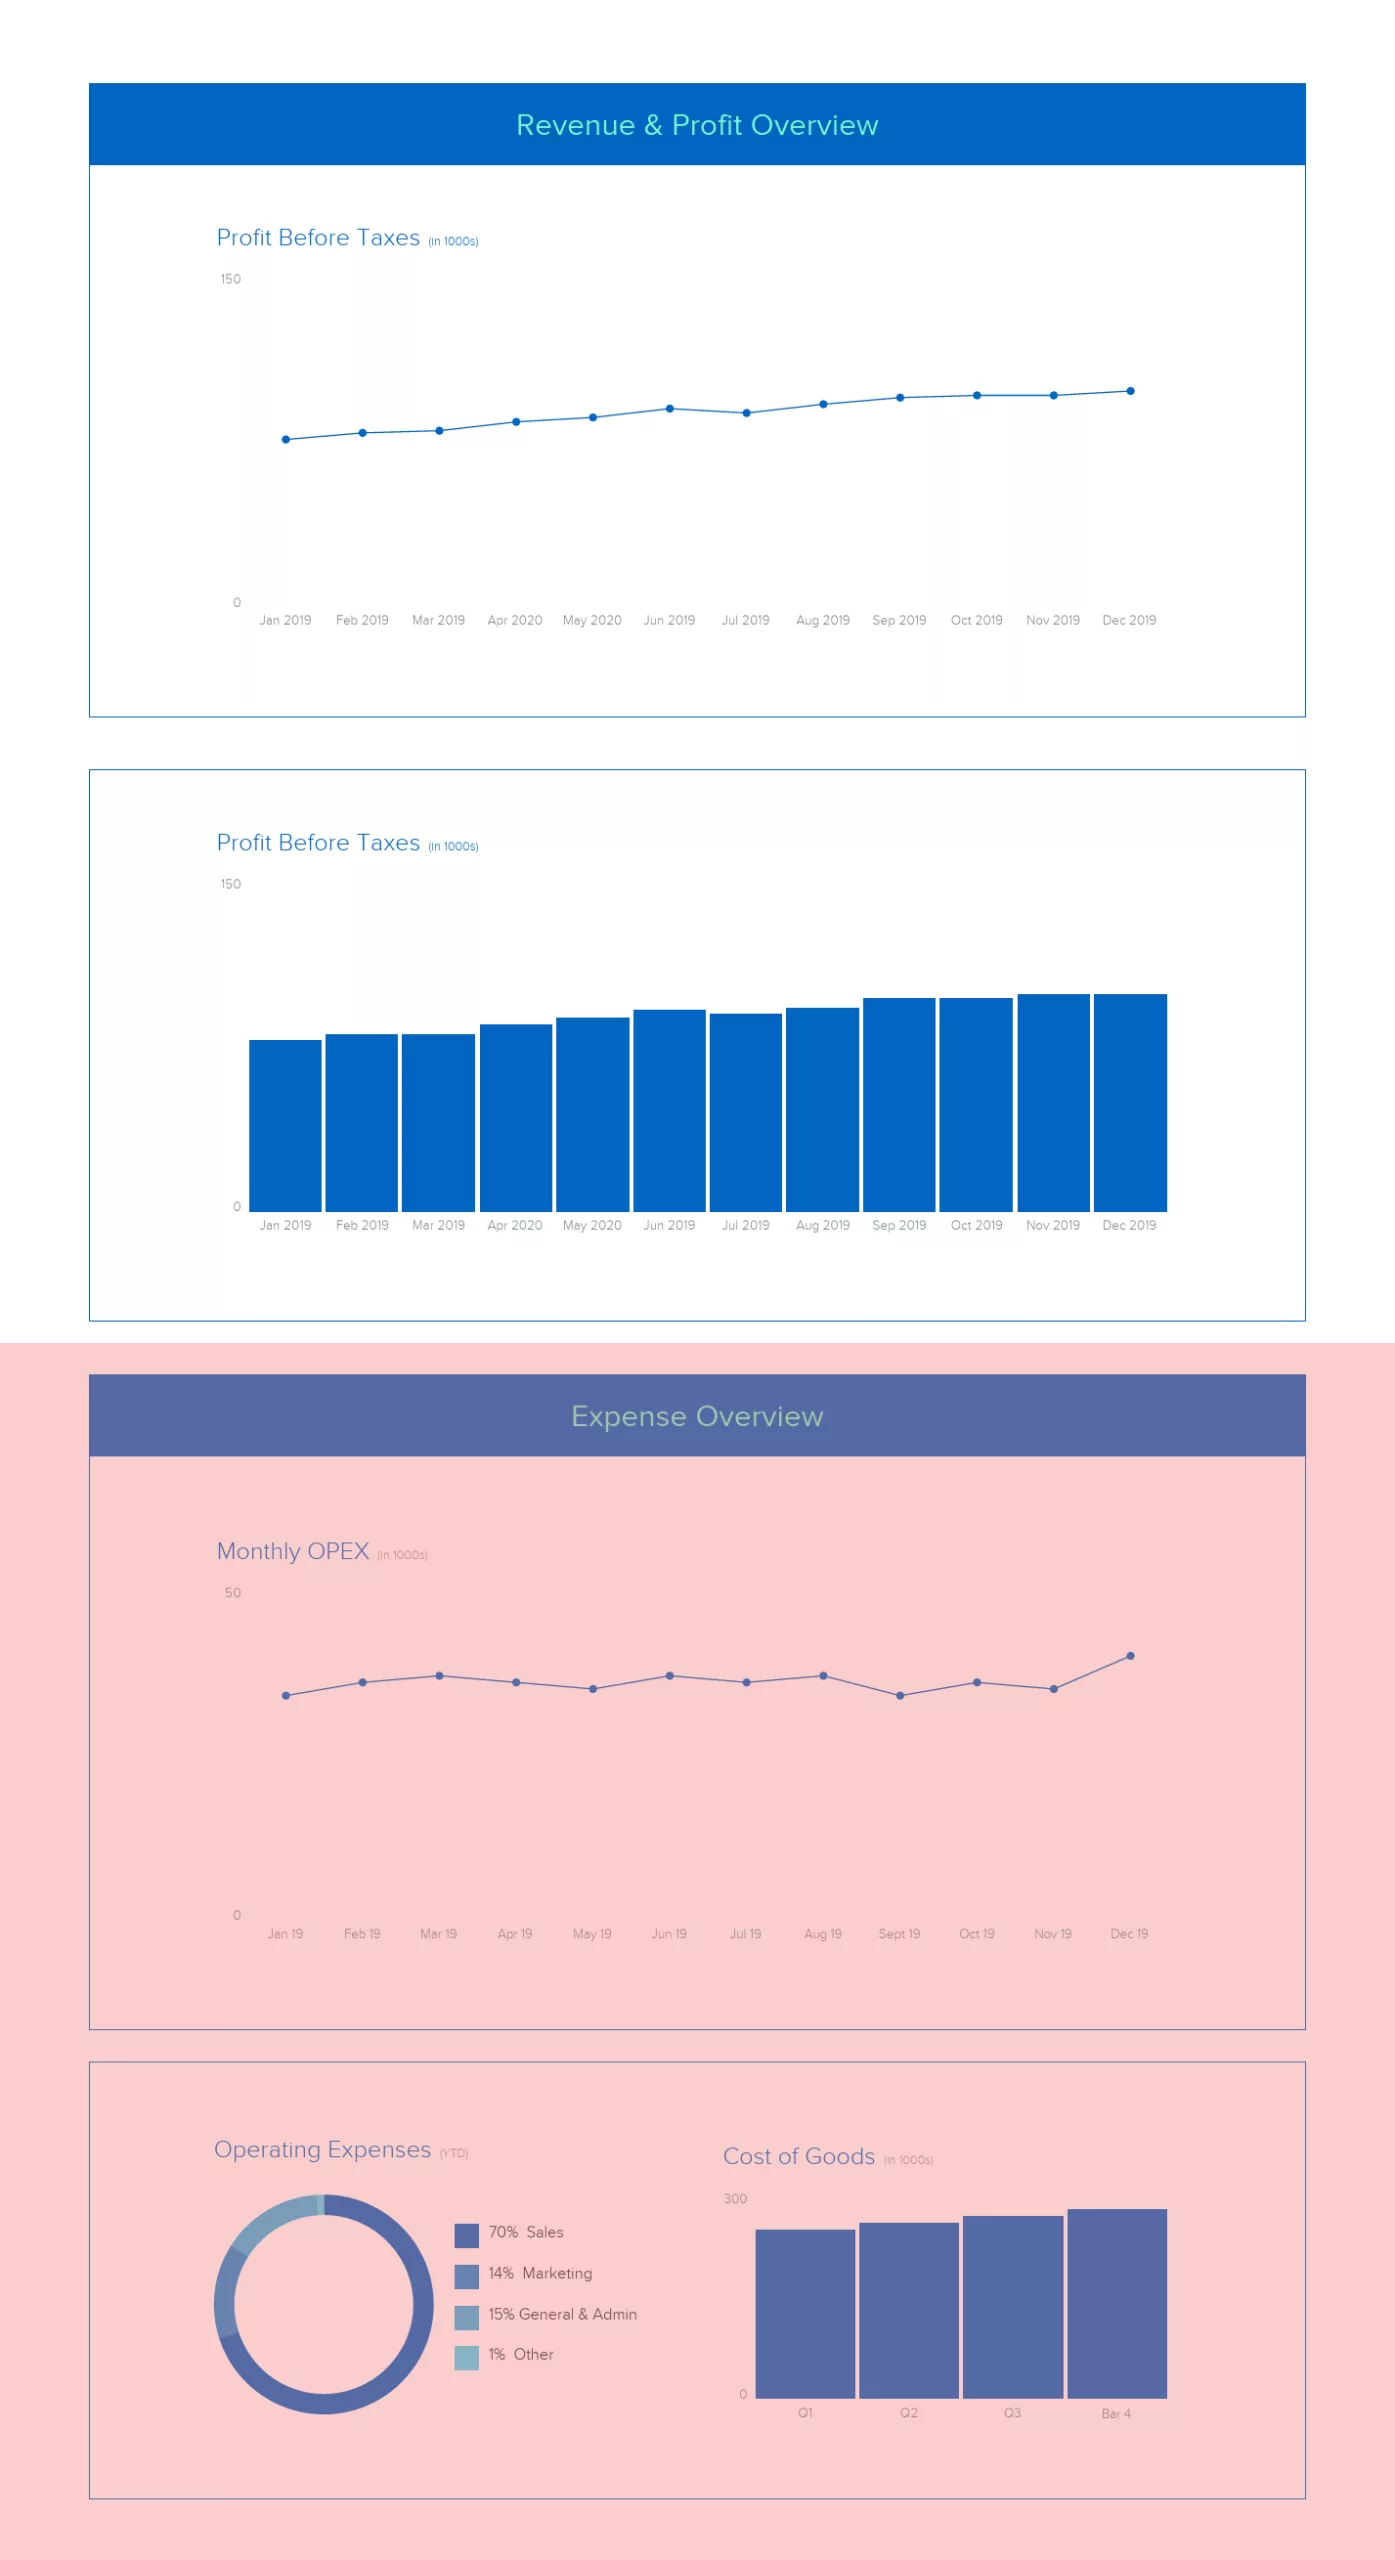
Include a cash flow summary that shows when money came in and went out throughout the year. Even profitable organizations can face cash crunches if revenue arrives in Q4 but expenses are spread evenly. Visualize this as a monthly line chart for immediate clarity.
Close with recommendations: what should change next year based on this year’s data? Which line items need larger allocations? Which can be reduced? What new investments does the data support? Share the full report as a live link so stakeholders can reference it during planning discussions.
Common Budget Report Mistakes
The most damaging mistake is presenting numbers without context. A 15% overspend in marketing could be a problem (uncontrolled spending) or a success (we invested more because the campaign was working). Every significant variance needs a one-sentence explanation.
Another error is using inconsistent categories across years. If you restructured departments or changed expense categories mid-year, explain the change and restate prior-year numbers for comparison. Apples-to-oranges comparisons destroy credibility.
Avoid burying the bad news. Stakeholders lose trust when they discover overspends that were hidden in aggregate numbers. Present unfavorable variances prominently, explain what caused them, and describe what you are doing to prevent recurrence.
Finally, do not skip the forward-looking section. A report that only looks backward is a history lesson. Leadership reads budget reports to make decisions about the future — give them recommendations backed by the data you just presented.
Step-by-Step Guide
Step 1: Determine the Accounting Period
Decide on the 12-month period for your budget report. This could align with the calendar year or your fiscal year.
Step 2: Identify Business Units
Identify each department or division within your organization, as each will have its own set of revenues and expenses.
Step 3: Establish Financial Goals
Set financial goals for the year, such as increasing revenue, cutting costs, or expanding into new markets. These goals will guide your resource allocation.
Step 4: Collaborate with Finance Leaders
Work with finance leaders to analyze past performance, predict future trends, and make informed decisions about resource allocation. Include key metrics on cash flow, expenses, income statements, and net profit. Provide an overview of your company’s finances in the report.
Create an overview outlining your key metrics
Include key metrics on annual cash flow, expenses, income statements, and net profit, and provide an overview of your company’s financial status in the cover section.
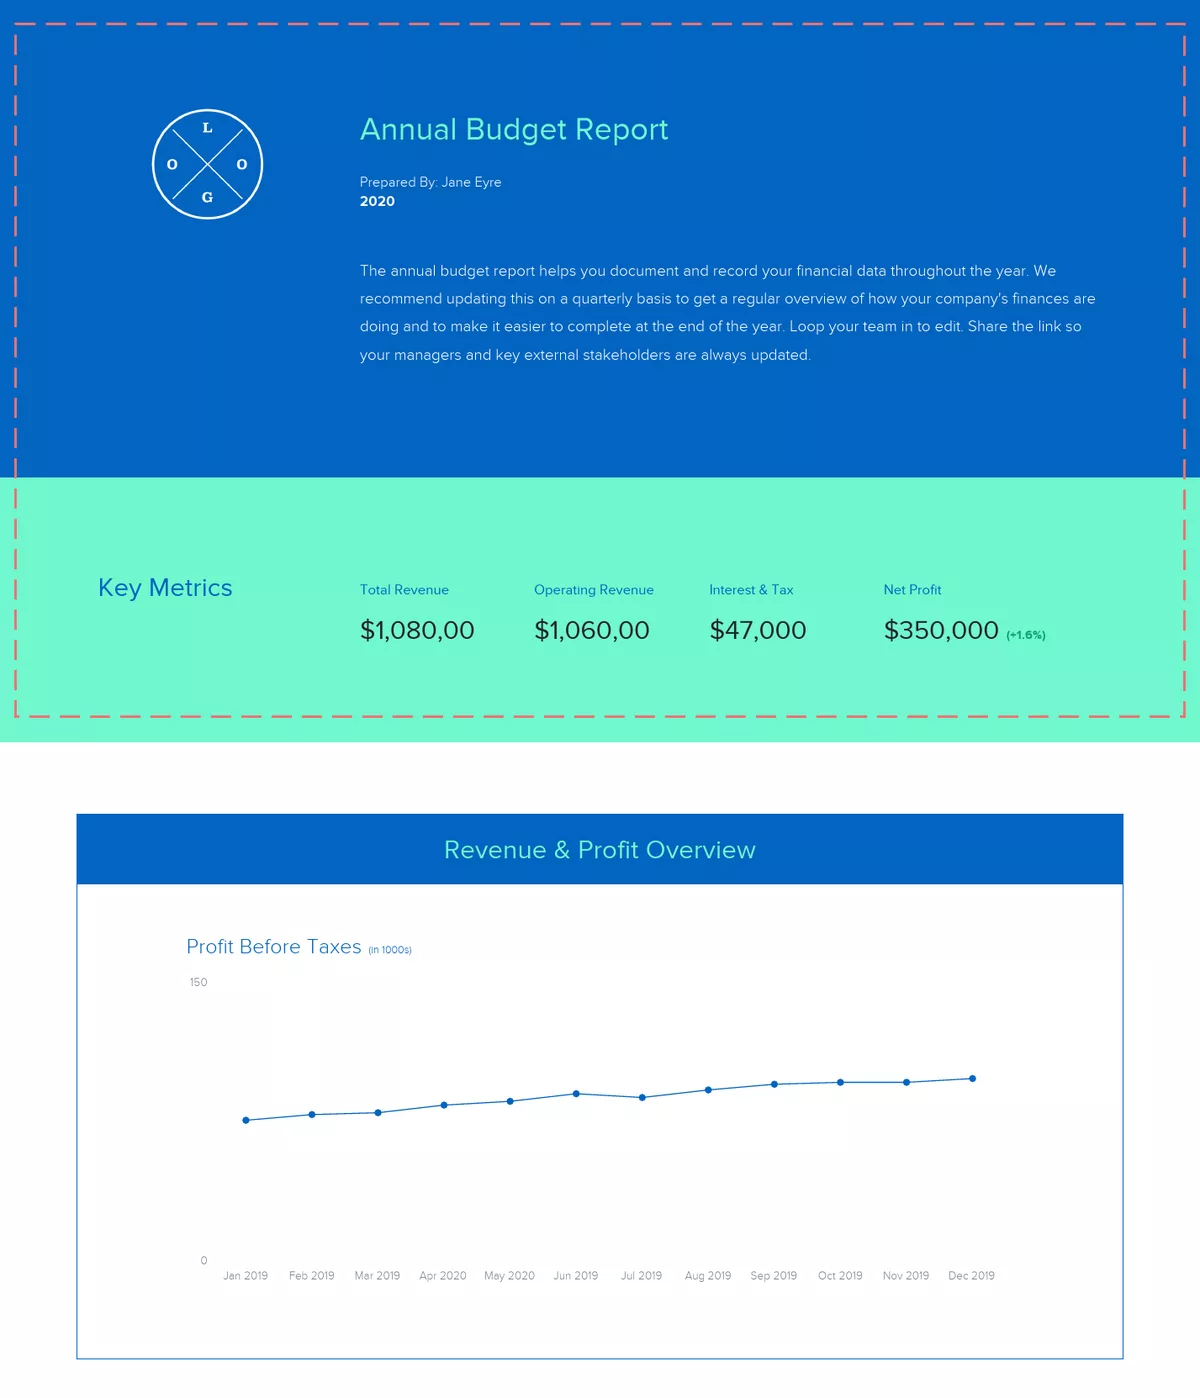
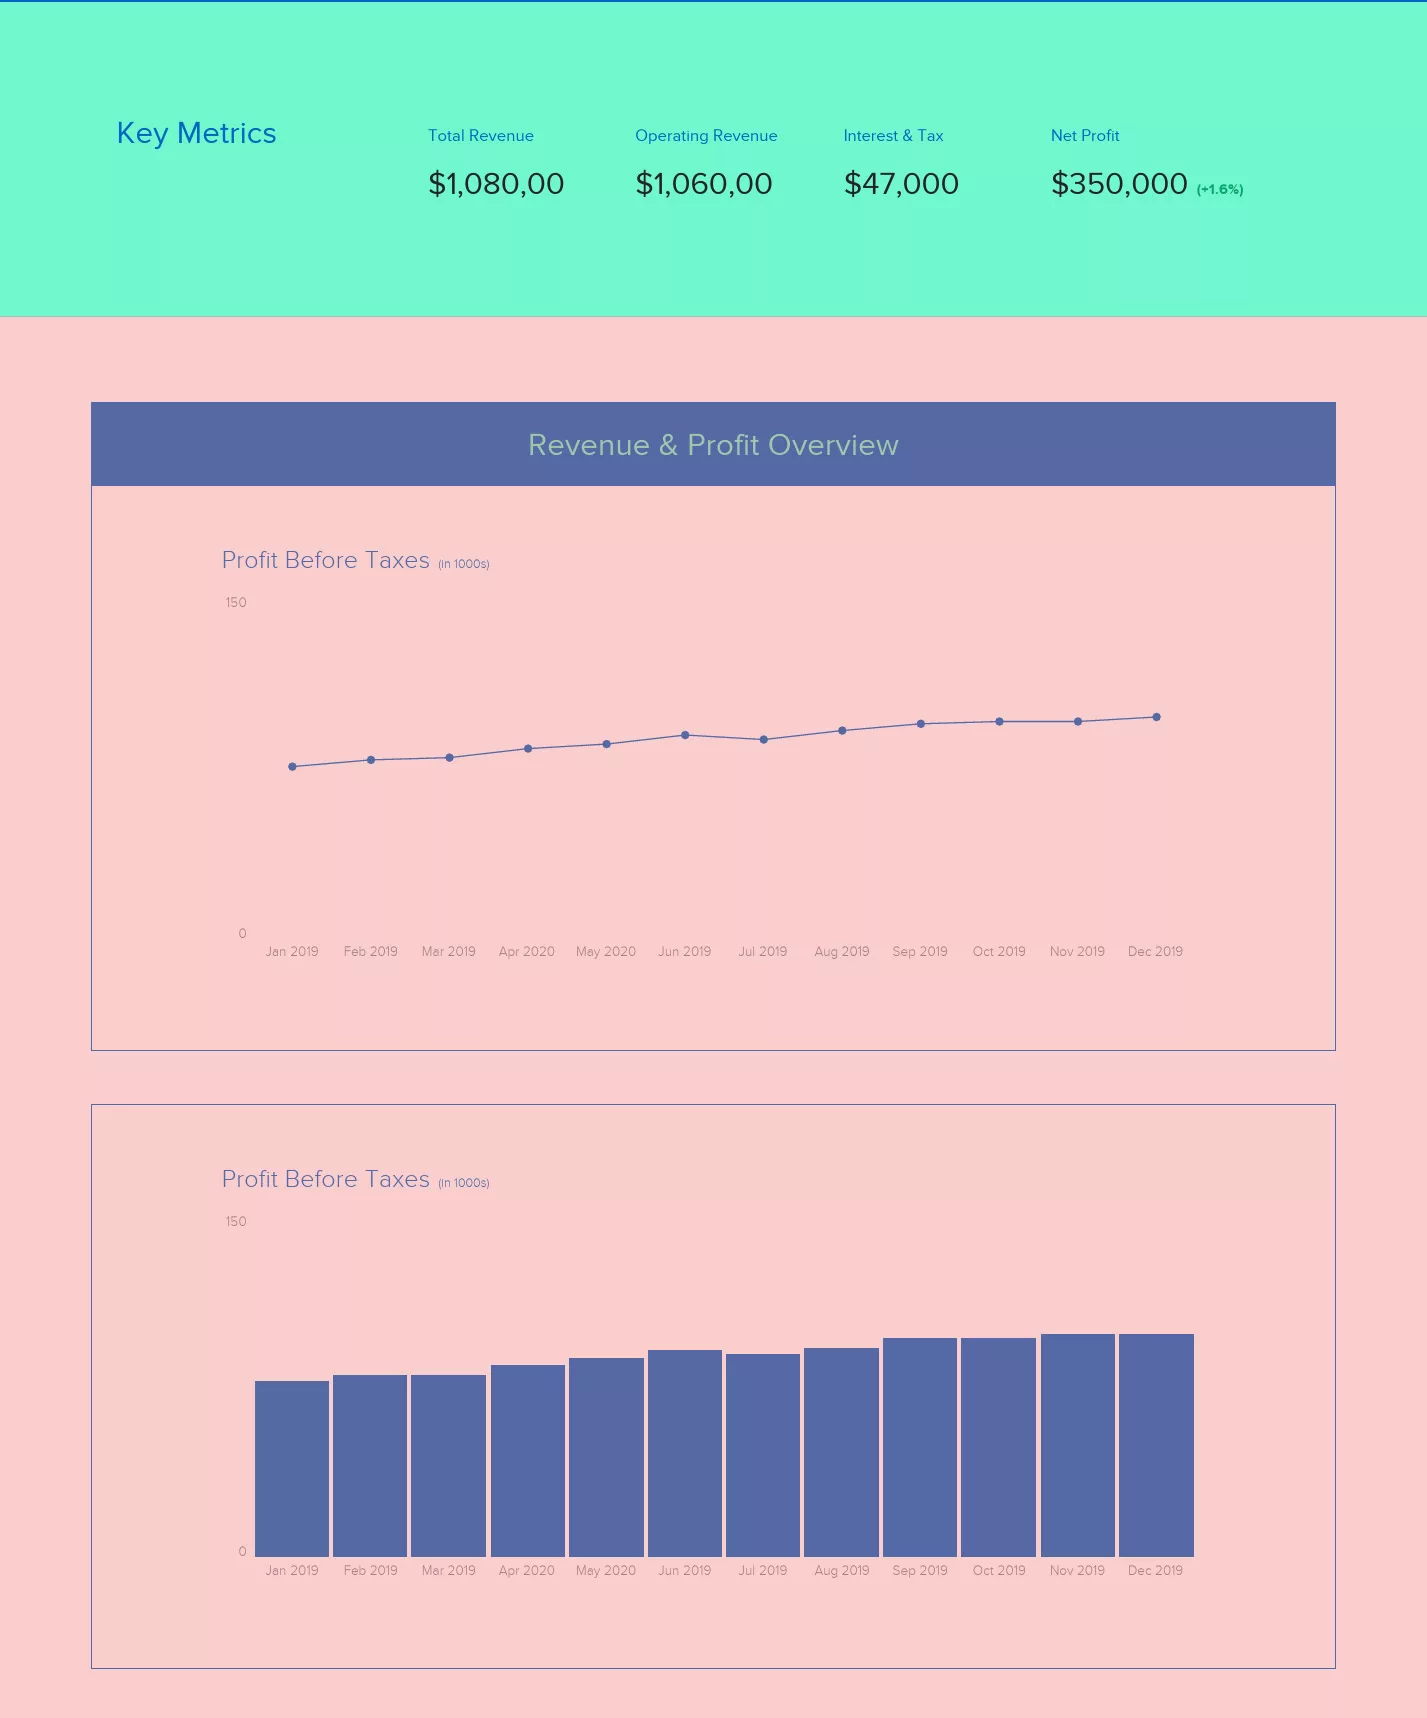
Most companies use charts and graphs to visualize data, keeping in mind that expected sales significantly influence costs. When making projections:
- Research: Look into industry guides, best practices, and competitor financial information if available.
- Growth Rate: Determine your recent monthly growth rate and assess if it can be sustained.
- Customer Communication: Understand your customers’ future needs for your product or service.
- Sales and Marketing: Discuss expected sales with your sales and marketing departments to set realistic expectations.
Using these insights, you can create accurate projections for your annual revenue and profit.
Calculate Your Annual Expenses
After outlining your annual revenue and profit, analyze your operating expenses. Determine the percentage of expenses for each department and include the cost of goods and services necessary to run your business.
Considerations for Determining Annual Expenses:
- Fixed Costs: These are straightforward to calculate and include rent, insurance, leases, and other set costs.
- Variable Costs: Costs directly related to revenue, such as inventory and employee services. Stable gross margins indicate potential cost savings.
- Employee Compensation and Headcount: Identify hiring needs, duration of the hiring process, and compensation levels aligned with revenue and growth projections for the coming year.
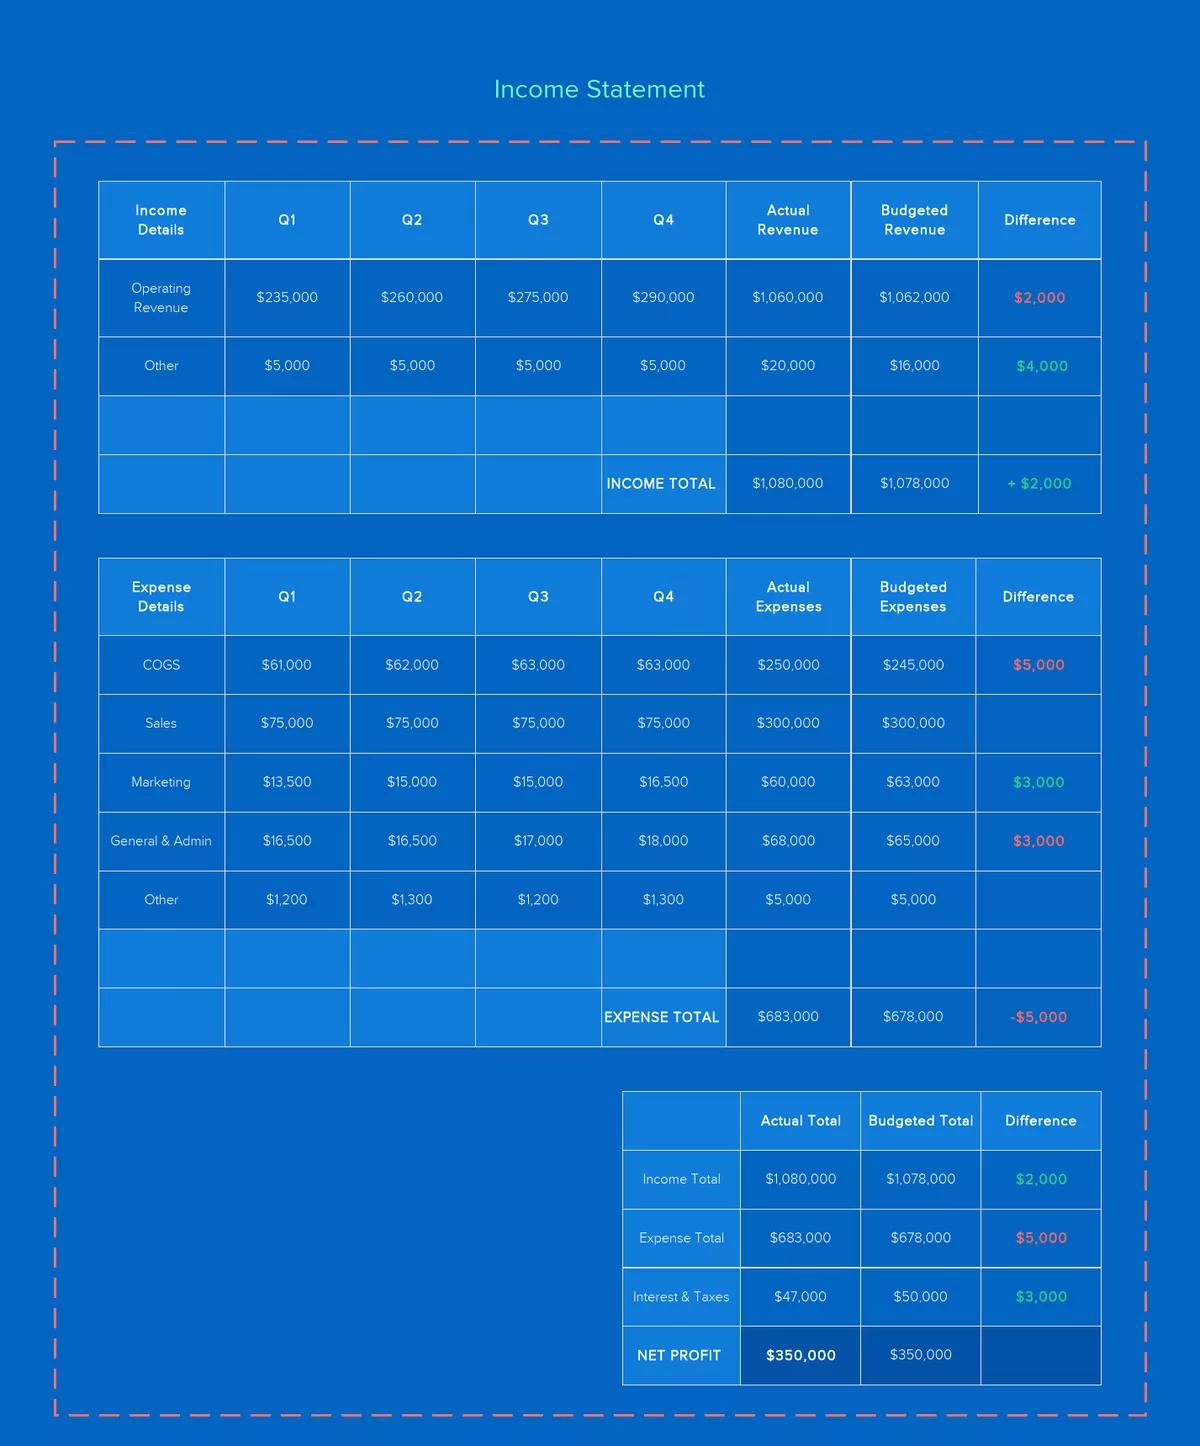
Include a Table to Detail Your Annual Income Statement
Including a detailed table in your annual income statement helps you analyze specific costs and profit avenues, allowing for better planning of savings and growth for the next year. Alongside visual graphs and charts, this detailed breakdown provides a comprehensive view of your financials.
Table Example: Annual Income Statement
| Category | Amount |
|---|---|
| Income | |
| Sales Revenue | $500,000 |
| Service Revenue | $200,000 |
| Investment Income | $50,000 |
| Total Income | $750,000 |
| Expenses | |
| Cost of Goods Sold | $300,000 |
| Salaries & Wages | $150,000 |
| Rent | $50,000 |
| Insurance | $20,000 |
| Utilities | $10,000 |
| Marketing | $30,000 |
| Office Supplies | $5,000 |
| Total Expenses | $565,000 |
| Net Profit | $185,000 |
Key Considerations
- Visual Graphs and Charts: Use these alongside the table to provide a clear and comprehensive view of your financial data.
- Analyze Specific Costs: Detail the costs associated with each department and operational activity.
- Profit Avenues: Identify and emphasize profitable areas to guide strategic planning for the coming year.
This comprehensive approach will help you identify cost-saving opportunities and plan for growth effectively.

Along with the annual budget report template, you can add task list modules to update the status of each item and keep track of the live document as the project progresses. This ensures all stakeholders maintain visibility into what’s in progress, what’s next, and what’s completed. Update statuses as you go and share the link to keep both your team and management on the same page.
Add a footer and give credit to key stakeholders
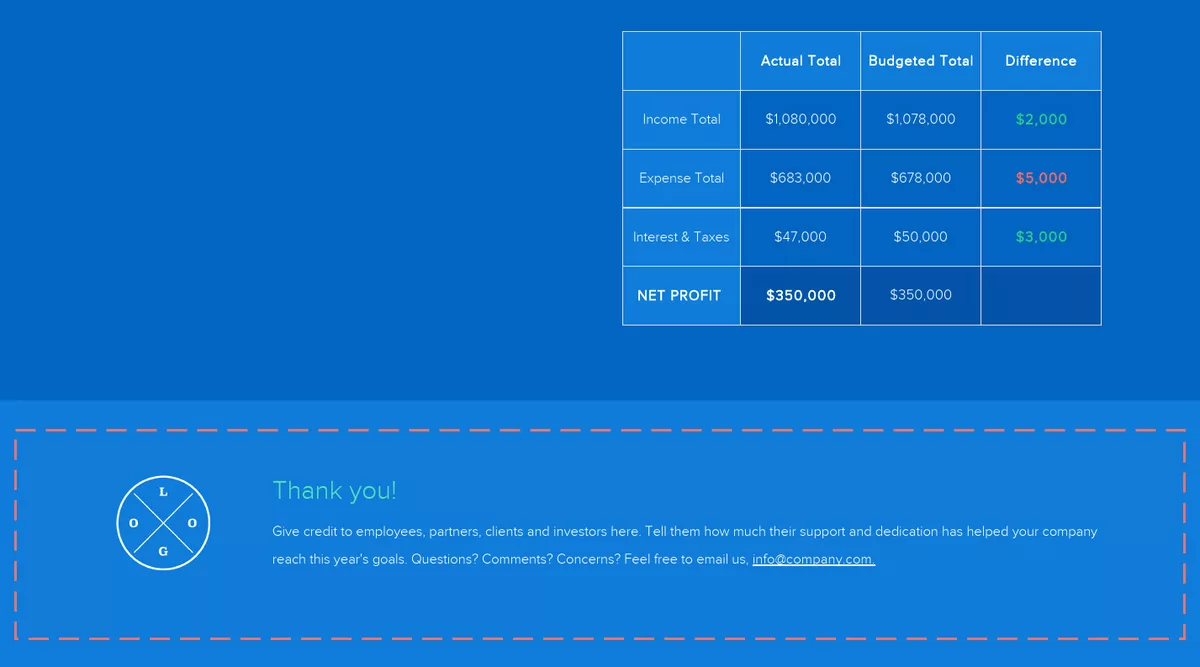
To close the report, acknowledge and give credit to the employees, partners, clients, and investors who have contributed to the company’s success. Express gratitude for their support and dedication, highlighting how their efforts have helped the company achieve its goals for the year.
Include your company logo and contact information at the end of the report so external stakeholders and potential investors can easily get in touch with you. This not only shows appreciation but also fosters continued collaboration and support.
Share Your Budget Report as a Link, Monitor & Evaluate
When you’ve finished creating your annual budget report with Xtensio’s editor, you can send the live link to share it as a responsive webpage. For added security, you can also add password protection. The budget report template is adaptable—like other Xtensio tools, it can and should be repurposed, revisited, and revised regularly throughout the year. We recommend updating it quarterly.
Thank you for using this guide. We hope it helps you achieve your financial goals and confidently navigate the year ahead.
Written by

Design, manage and share beautiful living documents… easily, together. Explore Xtensio
- Click and edit anything… together.
- Customize to match your branding.
- Share with a link, present, embed or download.

Create and deliver beautiful work, professionally.
Build, brand, and deliver living documents your clients actually engage with.







Join 410,571 professionals delivering work with Xtensio.
Related reports: Annual Report Template, Monthly Performance Report Template