How to Perform Effective Root Cause Analysis: Step-by-Step Guide
Updated by Xtensio
Root Cause Analysis (RCA) helps you dig deeper and fix the real issues behind recurring headaches. Whether you’re dealing with quality issues in manufacturing, glitches in software, or process failures in healthcare, RCA offers a straightforward way to find out what’s really going on and stop it from happening again. In this guide, we’ll break down the steps, tools, and tips you need to start solving problems once and for all. Follow along with this free template.
Listen to this Article:
Xtensio is your team space for beautiful living documents.
Create, manage and share business collateral, easily.
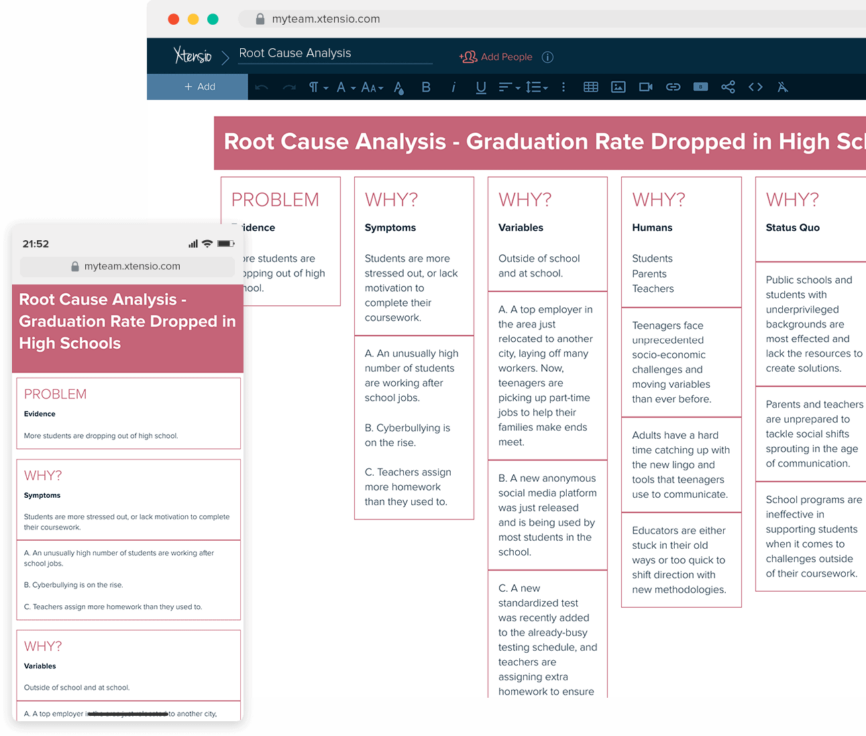
Table of Contents
Introduction to Root Cause Analysis (RCA)

Root Cause Analysis (RCA) is a straightforward method for finding the underlying reasons behind a problem, not just the symptoms. It’s used to figure out why something went wrong, so you can prevent it from happening again. RCA is a valuable tool across many industries — from healthcare, where it helps improve patient safety, to manufacturing, where it boosts product quality, and in IT, where it keeps systems running smoothly. No matter the field, RCA helps teams tackle problems at their source.
What is Root Cause Analysis?
Root Cause Analysis (RCA) is a method used to identify the underlying reasons behind a problem, not just the obvious symptoms. By pinpointing the root cause, RCA helps you tackle the actual source of an issue, ensuring it doesn’t come back. The benefits are clear: better problem-solving, fewer recurring problems, and more efficient processes. Whether you’re in healthcare, manufacturing, IT, or any other field, RCA helps improve outcomes by addressing what truly went wrong and creating solutions that last.
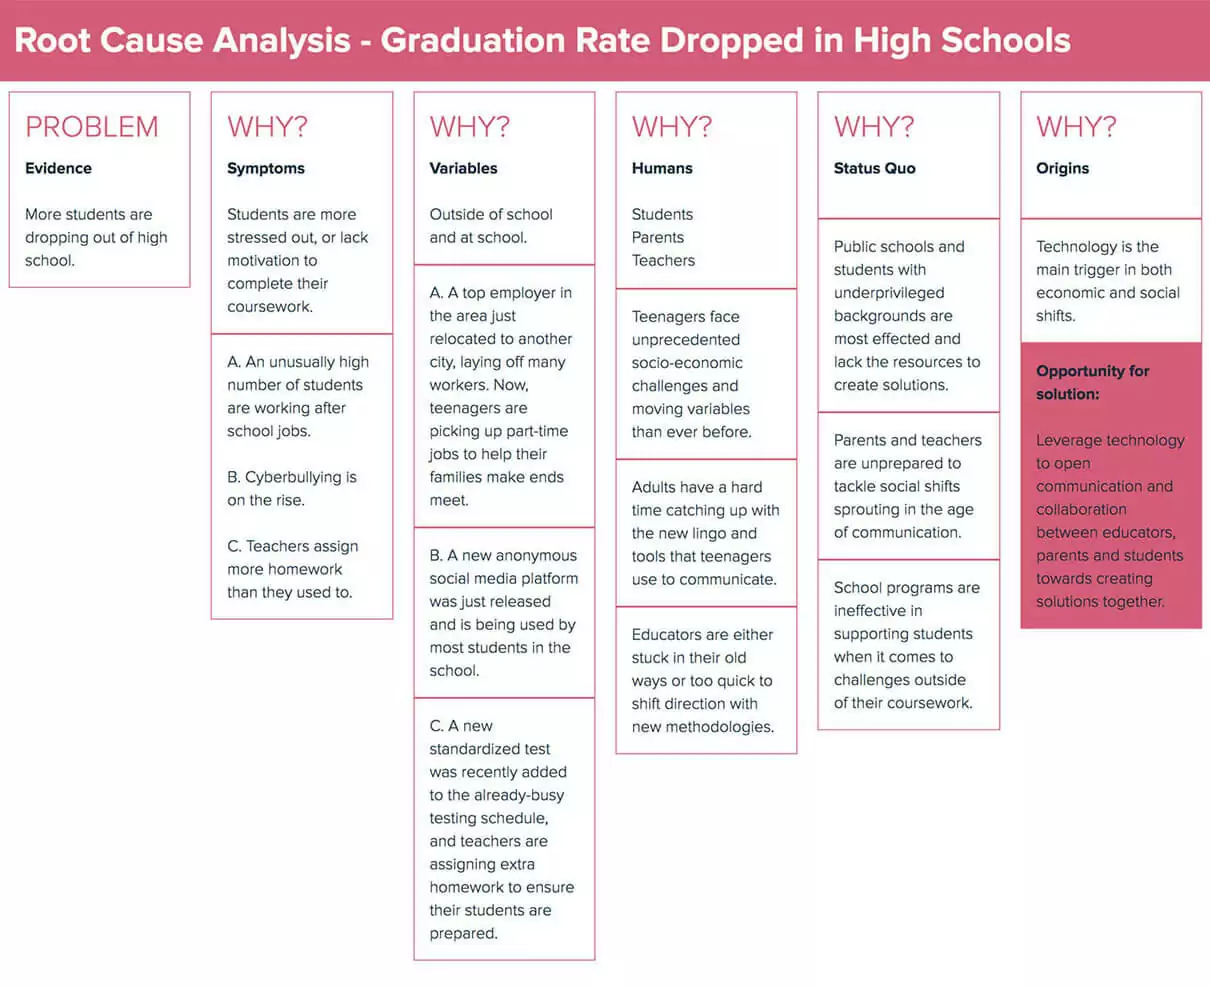
Types of Root Causes
Root causes can usually be grouped into three main types:
- Physical Causes: These are tangible, material factors like equipment failures or environmental conditions that directly cause a problem.
- Human Causes: These involve errors or actions by people, such as mistakes, omissions, or miscommunications.
- Organizational Causes: These relate to flaws in processes, policies, or systems, like poor training, unclear procedures, or inadequate resources that create the conditions for problems to occur.
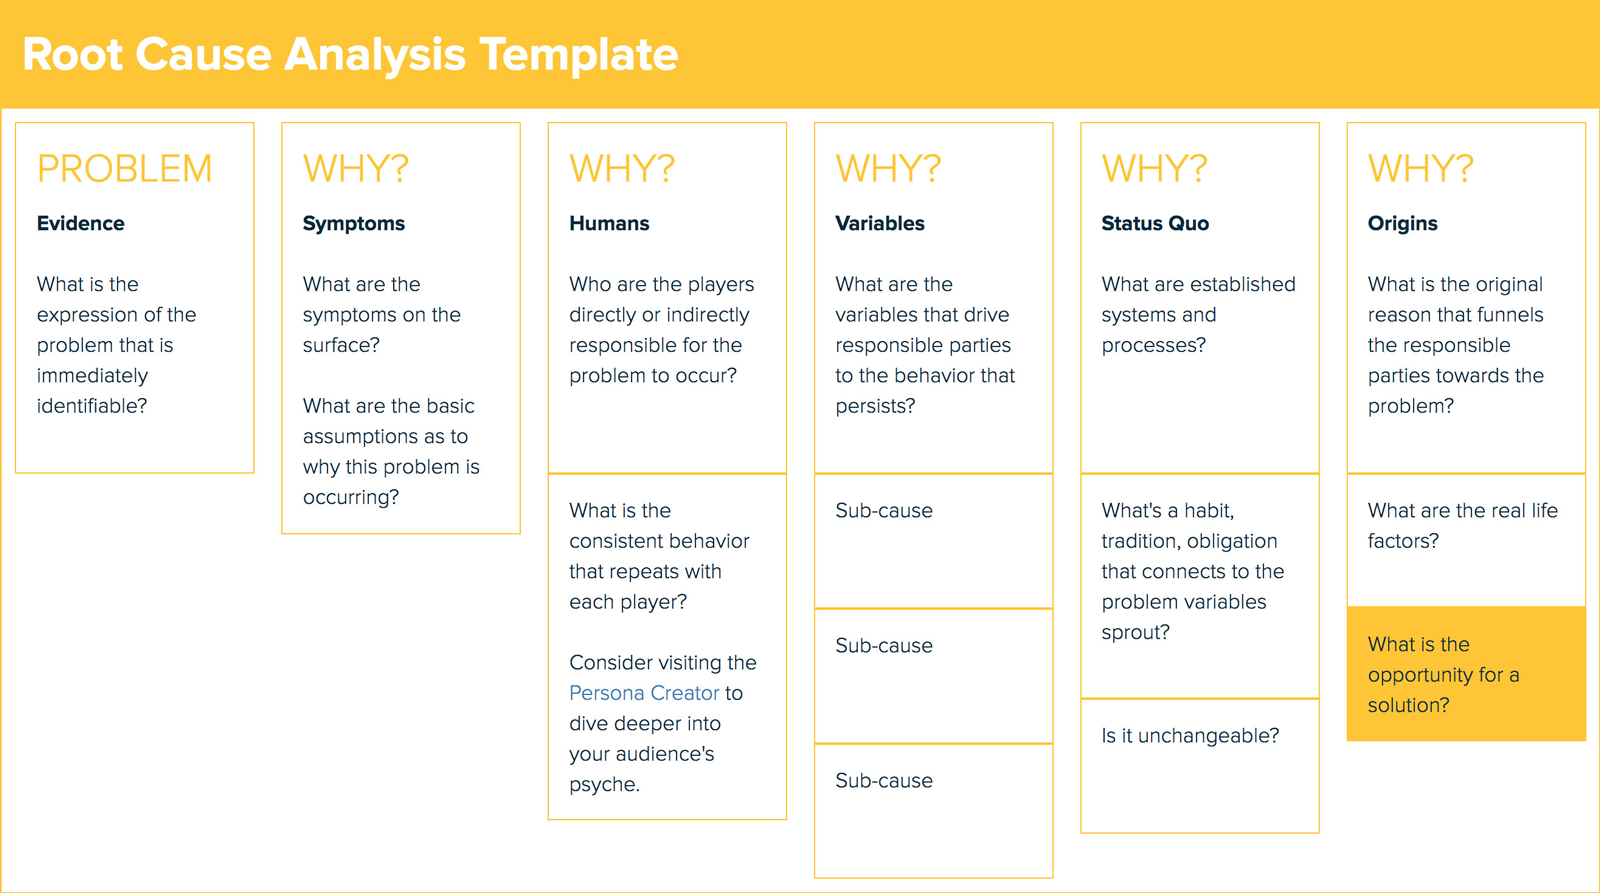
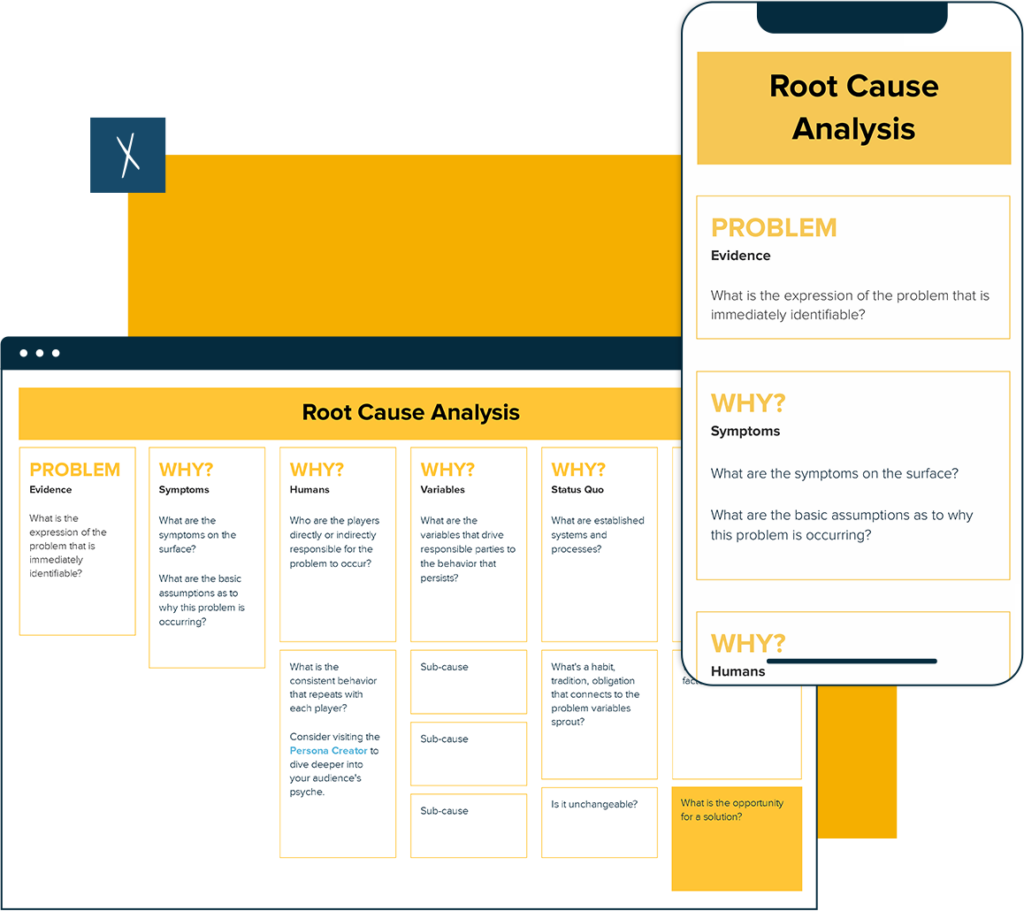
Above is Xtensio’s free editable and interactive template to create a Root Cause Analysis.
Core Principles of Effective Root Cause Analysis
- Take a Systematic Approach: Follow a clear, step-by-step method to uncover the true cause of a problem.
- Base Decisions on Data: Use accurate data and evidence to understand what went wrong, rather than assumptions or guesses.
- Create a Blame-Free Environment: Focus on finding solutions, not assigning blame. Encourage openness and honesty so the team can learn and improve together.
These principles help ensure that your analysis is thorough, objective, and constructive, leading to more effective problem-solving.
Step-by-Step Guide to Conducting Root Cause Analysis
- Define the Problem: Clearly describe the problem you’re trying to solve. Be specific about what is happening, where, and why it matters.
- Gather Data: Collect all relevant data to understand the scope of the problem. Look for patterns, timelines, and any contributing factors.
- Identify Causal Factors: Determine the factors that could be contributing to the problem. Use tools like brainstorming or creating a timeline of events.
- Determine the Root Cause(s): Apply techniques like the 5 Whys or Fishbone Diagram to pinpoint the true cause behind the issue.
- Develop Solutions: Brainstorm and choose corrective actions that address the root cause. Prioritize solutions that are feasible and effective.
- Implement and Monitor Solutions: Put the solutions into action and keep track of their effectiveness over time. Adjust as needed to ensure the problem is fully resolved.
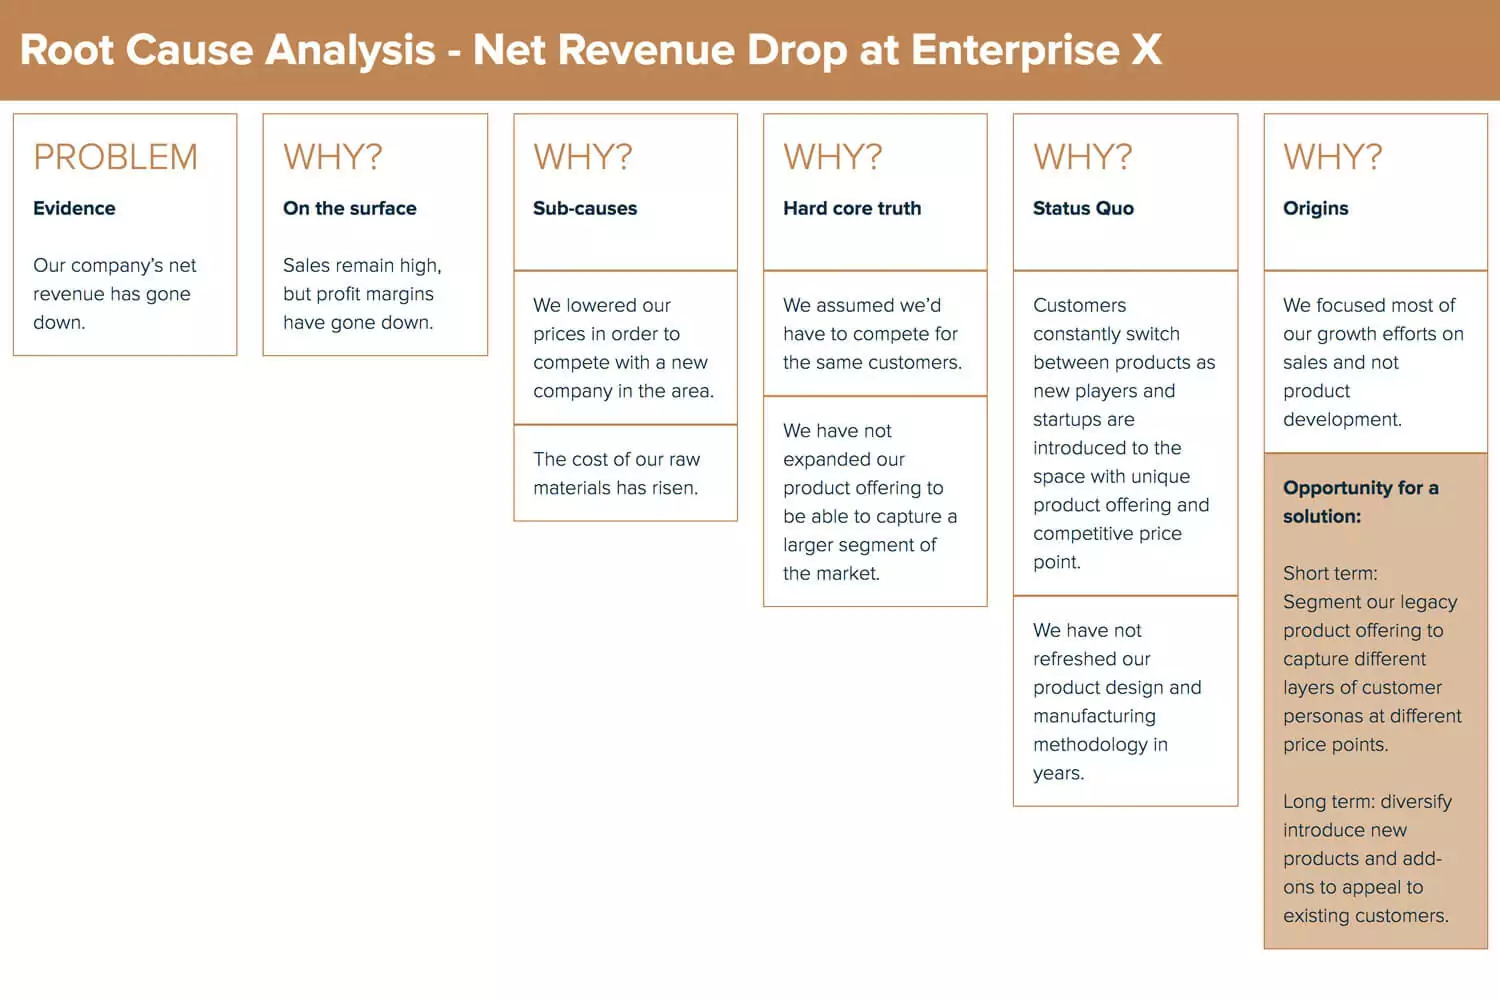
Popular Tools and Techniques for Root Cause Analysis
- 5 Whys Analysis: A simple, iterative questioning technique that helps uncover the root cause by repeatedly asking “Why?” until the fundamental issue is identified. See Xtensio’s 5 Whys Analysis Template
- Fishbone Diagram (Ishikawa): A visual tool for categorizing potential causes of a problem into key categories like people, processes, and materials. See example
- Failure Mode and Effects Analysis (FMEA): Prioritizes potential failure modes based on their impact and likelihood, helping to focus on the most critical areas. Explore FMEA
- Pareto Charts: Visualize problems to prioritize efforts on the most significant issues (the 80/20 rule). More details
- Fault Tree Analysis: A deductive technique that maps the different paths leading to a failure, helping to understand and prevent system breakdowns. Learn how to use it
Common Challenges and Mistakes in Root Cause Analysis
- Overlooking Data: Skipping or ignoring relevant data can lead to incorrect conclusions about the root cause.
- Narrow Problem Definitions: Defining the problem too narrowly can miss broader, underlying causes, leading to incomplete solutions.
- Lack of Follow-Through: Even if the root cause is identified, failure to implement corrective actions or monitor results can cause problems to recur.
Industry-Specific Applications of Root Cause Analysis (RCA)
- Healthcare: RCA is often used to improve patient safety by analyzing incidents like medication errors or surgical complications. For example, an RCA might reveal that a lack of proper communication between teams led to a mistake, prompting new protocols to ensure accurate handoffs between shifts.
- Manufacturing: In manufacturing, RCA helps identify quality control issues, such as defects in products. For example, it could trace the root cause of a defective batch to faulty machinery, leading to preventive maintenance schedules.
- IT and Software Development: RCA is crucial for debugging and resolving recurring system failures. For example, it may find that a system outage was caused by inadequate server capacity, resulting in the implementation of more robust infrastructure solutions.
By applying RCA tailored to each industry, organizations can address the specific challenges they face effectively.
Real-Life Examples and Case Studies of Root Cause Analysis (RCA)
- Healthcare: After a series of patient falls in a hospital, an RCA identified the root cause as inadequate staff training on fall prevention. The solution was to implement mandatory training programs, resulting in a 30% reduction in falls within six months.
- Manufacturing: A car manufacturer faced repeated defects in its braking systems. RCA revealed that the root cause was inconsistent material quality from a specific supplier. Changing suppliers and adding quality checks reduced defects by 40%.
- IT and Software Development: An e-commerce site experienced frequent server outages during peak traffic times. RCA showed that the server infrastructure wasn’t scaling properly. The company upgraded its server capacity, eliminating outages and improving customer experience.
Best Practices for Effective Root Cause Analysis (RCA)
- Involve Cross-Functional Teams: Use a collaborative platform to bring together people from different departments and roles. This ensures diverse perspectives and helps uncover hidden causes.
- Use the Right Tools: Choose the appropriate RCA techniques, like the 5 Whys or Fishbone Diagram, based on the problem’s complexity. Xtensio offers customizable templates that make it easy to apply these techniques in a structured way.
- Maintain Transparency: Keep the process open and allow for real-time updates and feedback. This promotes trust and ensures everyone stays aligned with the findings and solutions.
- Focus on Prevention, Not Blame: Foster a blame-free environment to encourage honest discussions. The goal is to find out what went wrong and how to prevent it in the future.
- Document Findings Clearly: Make sure all findings, causes, and actions are documented in an easy-to-update and shareable format. Xtensio’s live documents help ensure that everyone has access to the most current information.
- Follow Up on Solutions: Regularly review the effectiveness of the solutions implemented and make necessary adjustments to continue improving processes over time.
Frequently Asked Questions
What is Root Cause Analysis (RCA)?
Root Cause Analysis (RCA) is a method used to identify the underlying causes of a problem, rather than just treating the symptoms. By finding the true cause, RCA helps prevent the issue from recurring.
Why is Root Cause Analysis important?
RCA is important because it helps organizations improve their processes, reduce costs associated with repeated problems, and enhance overall performance by addressing the root causes of issues.
What are the main tools used in RCA?
Common tools used in RCA include the 5 Whys, Fishbone Diagram (Ishikawa), Failure Mode and Effects Analysis (FMEA), and Pareto Charts. These tools help systematically identify and address the underlying causes of problems.
How do I choose the right RCA tool?
Choose the RCA tool based on the complexity and nature of the problem. For simple problems, the 5 Whys might be enough. For more complex issues, tools like the Fishbone Diagram or FMEA provide a more detailed analysis.
Can RCA be applied in any industry?
Yes, RCA is versatile and can be applied in various industries such as healthcare, manufacturing, IT, and more. It is useful anywhere there is a need to solve recurring problems and improve processes.
How does Xtensio help with RCA?
Xtensio offers templates for popular RCA tools, such as the 5 Whys and the Root Cause Analysis Templates, and provides a collaborative platform that makes it easier to document, share, and update findings and solutions in real-time.
Conclusion and Next Steps
Root Cause Analysis (RCA) is an essential process for identifying and addressing the true causes of problems, helping you prevent them from happening again. By following a structured approach, using the right tools, and fostering a transparent, blame-free environment, you can achieve lasting improvements in your organization.
Ready to put RCA into action? Start using Xtensio’s customizable templates and collaborative tools to streamline your analysis, document findings, and share solutions effortlessly. Get started today and empower your team to solve problems more effectively.
Additional Resources and Further Reading
- Understanding Root Cause Analysis: Dive deeper into the principles and practices of RCA with this comprehensive guide from American Society for Quality (ASQ).
- Practical RCA Tools and Techniques: Explore different RCA tools, such as the 5 Whys and Fishbone Diagram, and their applications at MindTools.
- Real-Life RCA Case Studies: Learn from real-life examples and case studies on RCA implementation in various industries from Harvard Business Review.
- Templates and Tools for RCA: Use customizable templates to streamline your RCA process with Xtensio.
Root Cause Analysis Methods Compared: 5 Whys, Fishbone, Fault Tree, and Pareto
Every root cause analysis method has a sweet spot. Choosing the wrong one wastes time and produces shallow findings. Here is a practical comparison of the four most widely used methods so you can match the technique to the problem.
5 Whys: Best for Speed
The 5 Whys method works by asking “Why?” repeatedly until you move past symptoms and reach the underlying cause. It requires no special tools, no training, and no software. A product team can run a 5 Whys session in 15 minutes on a whiteboard or inside a shared root cause analysis template.
When to use it: Single-thread problems with a relatively clear chain of events. A customer complaint about a delayed shipment, a missed deadline, or a bug that slipped through QA.
Limitation: 5 Whys can oversimplify problems that have multiple contributing factors. If you find yourself branching into two or three parallel “why” chains, switch to Fishbone.
Fishbone Diagram (Ishikawa): Best for Complexity
The Fishbone Diagram organizes potential causes into categories: People, Process, Materials, Equipment, Environment, and Management. Each “bone” branches into sub-causes, giving the team a visual map of every factor that could contribute to the problem.
When to use it: Problems with many possible contributors, especially when different departments are involved. A spike in customer churn, a quality control failure across multiple production lines, or a hospital readmission pattern.
Limitation: A Fishbone diagram can become overwhelming if the team lists too many causes without prioritizing. Pair it with a Pareto analysis to rank what matters most.
Fault Tree Analysis: Best for Systems
Fault Tree Analysis (FTA) works top-down. You start with the undesired event and map every possible path that could lead to it using logic gates (AND/OR). FTA is common in aerospace, nuclear energy, and software reliability engineering because it accounts for cascading failures and compound conditions.
When to use it: High-stakes systems where a single failure can trigger a chain reaction. Server infrastructure outages, safety incidents, or product recalls.
Limitation: FTA requires upfront knowledge of the system architecture. It is time-intensive and works best when you have a detailed process map to reference.
Pareto Analysis: Best for Prioritization
The Pareto principle (80/20 rule) states that roughly 80% of problems come from 20% of causes. A Pareto chart ranks contributing factors by frequency or impact, letting the team focus energy where it matters most.
When to use it: After a brainstorming session or Fishbone exercise when you have a long list of potential causes and need to decide which ones to investigate first. Also useful for recurring defect analysis in manufacturing or support ticket categorization.
Limitation: Pareto shows you what is most frequent, not necessarily what is most critical. A rare cause can still be catastrophic. Always cross-reference frequency with severity.
Quick Comparison Table
5 Whys takes 15 to 30 minutes, needs no tools, and works best for single-thread linear problems. Fishbone takes 1 to 2 hours, uses a whiteboard or template, and handles complex multi-factor problems. Fault Tree takes 2 to 4 hours, requires process maps and logic diagrams, and suits high-stakes system failures. Pareto takes 30 to 60 minutes, uses a spreadsheet or chart, and excels at prioritizing a long cause list.
The best teams do not pick one method and use it for everything. They match the method to the situation. Start with 5 Whys for quick triage, escalate to Fishbone when complexity grows, and layer Pareto on top to prioritize corrective actions.
Root Cause Analysis Examples by Industry
Theory only gets you so far. Below are four worked examples showing how a specific RCA method applies to a real problem in four different industries. Each example follows a problem statement, the method used, the analysis steps, and the corrective action.
Manufacturing: Equipment Failure (5 Whys)
Problem: A packaging line stops unexpectedly three times per week, causing 12 hours of lost production each month.
5 Whys walkthrough: Why did the line stop? A conveyor belt motor overheated. Why did it overheat? The cooling fan was clogged with dust. Why was the fan clogged? The maintenance schedule only covers quarterly cleaning. Why is cleaning only quarterly? The schedule was written five years ago when production ran one shift, not three. Why was it never updated? No formal review process exists for maintenance schedules when production volume changes.
Root cause: Maintenance schedules are not linked to production volume changes.
Corrective action: Tie preventive maintenance frequency to production hours, not calendar dates. Add a trigger: any 20% increase in production hours automatically flags a maintenance review. Document the new protocol in a living deliverable that the operations team can update as conditions change.
Healthcare: Patient Safety Incident (Fishbone)
Problem: Three medication errors occurred in the same ward over two months, all involving incorrect dosage administered during the night shift.
Fishbone categories explored: People (fatigue from 12-hour shifts, agency nurses unfamiliar with protocols), Process (verbal handoffs instead of written, no double-check requirement for high-alert medications), Equipment (barcode scanner batteries dying overnight), Environment (dim lighting at medication carts), Management (no mandatory rest breaks, staffing ratios below recommended levels).
Root causes (multiple): No double-check protocol for high-alert meds, combined with scanner downtime removing the automated safety net.
Corrective action: Mandatory two-nurse verification for high-alert medications. Nightly scanner battery swap added to shift-start checklist. Findings documented and shared across all wards as a reusable reference so the same mistake does not get repeated in another department.
Software: Production Outage (Fault Tree)
Problem: A SaaS platform went down for 47 minutes during business hours, affecting 12,000 active users.
Fault tree breakdown: The top event (outage) required both a database failover failure AND a load balancer misconfiguration. The database failover failed because a config change during a routine update disabled the automatic failover trigger (AND: config change + no rollback test). The load balancer sent all traffic to a single node because a recent infrastructure migration changed the node naming convention without updating the balancer rules.
Root cause: Infrastructure changes do not have mandatory post-migration verification steps that test failover and load distribution under realistic traffic.
Corrective action: Add a “migration verification checklist” that runs automated failover and load tests after every infrastructure change. Publish post-mortem findings internally as a living document that the engineering team references before future migrations.
Customer Success: Churn Spike (Pareto)
Problem: Monthly churn jumped from 3.2% to 5.8% over one quarter with no pricing or product changes.
Pareto analysis: The CS team categorized all 147 churn exit-survey responses. Results: 41% cited “can’t find features I need” (discoverability), 23% cited “onboarding was confusing,” 15% cited “too expensive for what I use,” 12% cited “switched to competitor,” 9% other. The top two categories (discoverability + onboarding) accounted for 64% of all churn.
Root cause: A recent UI redesign moved key features behind new navigation without updating the onboarding flow or in-app guidance.
Corrective action: Rebuild the onboarding sequence to match the new UI. Add contextual tooltips for relocated features. Track 30-day activation rates weekly and share the dashboard as a live link so product, CS, and leadership all see the same current data without waiting for a monthly report.
5 Root Cause Analysis Mistakes That Lead to Band-Aid Fixes
Most failed RCA efforts do not fail because of the method. They fail because of how the team applies it. These five mistakes are responsible for the majority of analyses that end in temporary patches instead of lasting solutions.
1. Stopping at Symptoms
The most common mistake is declaring a root cause too early. If you ask “Why did revenue drop?” and the answer is “because fewer deals closed,” that is a symptom, not a cause. A proper root cause analysis keeps digging: Why did fewer deals close? Why did the pipeline shrink? Why did lead quality decline? Each layer peels back another symptom until you reach something you can actually fix, like a targeting change that was never tested.
Fix: Apply the “can we prevent recurrence by addressing this?” test. If the answer is no, you have not gone deep enough.
2. Blaming People Instead of Processes
“The operator made an error” is almost never the root cause. It is a human reaction that points to a process gap: unclear instructions, inadequate training, unrealistic workloads, or missing safety checks. When an RCA ends with a person’s name, the real cause stays hidden, and the same mistake will happen again the next time someone is tired, rushed, or new.
Fix: Reframe every “human error” finding as a process question. “Why was the operator able to make this error?” leads to the systemic fix.
3. Analyzing in Isolation
When one department runs an RCA without input from the teams upstream or downstream, the analysis misses contributing factors that cross organizational boundaries. A logistics delay might look like a warehouse problem until you discover that procurement changed suppliers without notifying the warehouse team about new packaging dimensions.
Fix: Include at least one representative from each team that touches the affected process. Use a shared workspace so everyone contributes to the same living document instead of passing static files back and forth.
4. No Follow-Up on Corrective Actions
An RCA that identifies the root cause and recommends corrective actions but never tracks implementation is incomplete. Research from the American Society for Quality shows that organizations without formal follow-up processes see the same root cause reappear within 18 months in over 60% of cases.
Fix: Assign an owner and a review date for every corrective action. Publish findings as a living deliverable with clear status fields so the team can revisit and verify that fixes are holding.
5. Treating RCA as a One-Time Exercise
Some teams only perform root cause analysis after a crisis. By then, multiple smaller signals were ignored. Recurring minor issues, near-misses, and customer complaints often share the same root cause as the eventual big failure. Organizations that treat RCA as a recurring discipline catch problems while they are still small and inexpensive to fix.
Fix: Schedule regular RCA reviews (monthly or quarterly) tied to operational metrics. Keep a running log of findings that stays current and accessible to the whole team, not buried in a slide deck from last quarter.
How to Build a Root Cause Analysis Culture in Your Organization
The difference between organizations that solve problems permanently and those that keep fighting the same fires comes down to culture. RCA tools are only effective when the organization treats root cause thinking as a default behavior, not a special event triggered by a crisis.
Start with Blameless Post-Mortems
The single biggest blocker to honest root cause analysis is fear. If people believe that surfacing a mistake will lead to punishment, they will hide problems or point fingers. Blameless post-mortems remove that barrier by focusing exclusively on what happened and how to prevent it, never on who is at fault.
Google’s Site Reliability Engineering team popularized blameless post-mortems in tech, but the concept applies to any industry. The key principle: if a human could make this mistake, the system allowed it to happen. Fix the system.
Standardize Your RCA Templates
When every team uses a different format for documenting root cause analysis, findings get lost, patterns go unnoticed, and institutional knowledge evaporates. Standardizing on a single root cause analysis template creates consistency that compounds over time.
A good template includes: problem statement, timeline of events, method used, contributing factors, root cause(s), corrective actions with owners and deadlines, and a follow-up review date. When every analysis follows the same structure, it becomes easy to search past findings and spot recurring patterns.
Set a Review Cadence
Ad-hoc RCA happens only after something breaks. A scheduled review cadence catches small problems before they become large ones. Monthly operational reviews that include a “top 3 recurring issues” agenda item keep root cause thinking front and center.
For teams managing client deliverables, tying RCA reviews to project milestones works well. At the end of each project phase, ask: What problems did we encounter? What was the root cause? What do we change for the next phase? Document the answers in a shared workspace where they stay visible and current for the next project cycle.
Connect RCA Findings to Improvement Metrics
Root cause analysis loses credibility if the team never sees results. Tie each corrective action to a measurable outcome: defect rate, incident count, resolution time, or customer satisfaction score. Then track the metric over the 30, 60, and 90 days following the fix.
When the team can see that their RCA effort reduced defects by 35% or cut incident response time in half, the practice earns trust and becomes self-reinforcing. Share these results as a live link so stakeholders always see the latest numbers without asking for an update.
Make Findings Visible and Reusable
The final piece is accessibility. An RCA finding buried in someone’s personal drive or trapped in an email thread has a shelf life of about one week. The same finding stored in a shared, searchable workspace becomes institutional knowledge that prevents the same root cause from reappearing in a different department or project.
Build a library of past RCA reports that new team members can browse during onboarding. Tag each report by category (process, equipment, communication, training) so teams working on similar problems can reference relevant prior analyses. This is where living deliverables pay off: findings stay current because anyone with access can update them as new information surfaces, and the shared link always reflects the latest version.
Written by

Design, manage and share beautiful living documents… easily, together. Explore Xtensio
- Click and edit anything… together.
- Customize to match your branding.
- Share with a link, present, embed or download.

Create and deliver beautiful work, professionally.
Build, brand, and deliver living documents your clients actually engage with.








Join 409,446 professionals delivering work with Xtensio.