How To Write a Customer Success Report (With Template & Examples)
Updated by Xtensio
Reporting helps your customer service, support, and success team improve onboarding and engagement in your product by tracking important engagement analytics. Keeping track of success strategies and engagement metrics helps subscription service and SaaS companies make more informed business decisions that lead to happier customers. Use this step-by-step guide to create and iterate your monthly CS reports, easily. Explore this template.
Xtensio is your team space for beautiful living documents.
Create, manage and share business collateral, easily.
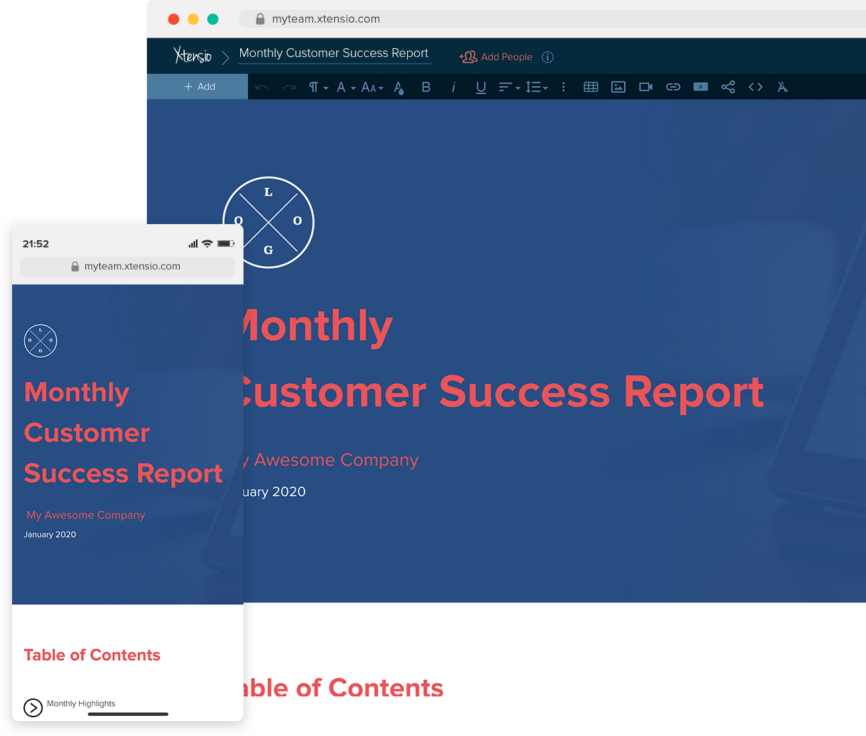
Table of Contents
Your guide to creating an impactful customer success report
Reporting helps your customer service, support and success team improve onboarding and engagement in your product by tracking important engagement analytics. The customer service team and customer success team uses this report to make sure customers are happy to use their product. Look into your marketing automation platform, customer success platform and internal data to find metrics that lead to understanding how your campaigns, customer support and other success efforts are performing. Keeping track of success strategies and engagement metrics helps subscription service and SaaS companies make more informed business decisions that lead to happier customers.
Use the CS report to analyze ongoing client success efforts and make more informed business decisions.
- Create a visually-rich report to monitor customer success initiatives and communicate findings with managers, executives and other important stakeholders.
- Analyze conversion rate, churn, recurring revenue, customer lifetime value and campaign success.
- Improve onboarding and engagement in your product with data-driven course corrections.
With Xtensio, you can easily generate your customer success reports tailored to your (or your client’s) CS objectives. Loop in colleagues, clients and key stakeholders to create and iterate on your reports. You can work hand-in-hand with colleagues on a live doc, leave feedback, and share a link so everyone is updated on the status of your customer success process, KPIs, and objectives.
Note: You may also want to explore the Annual Report Template to support your customer success report.
1. Create your customer success report header and table of contents
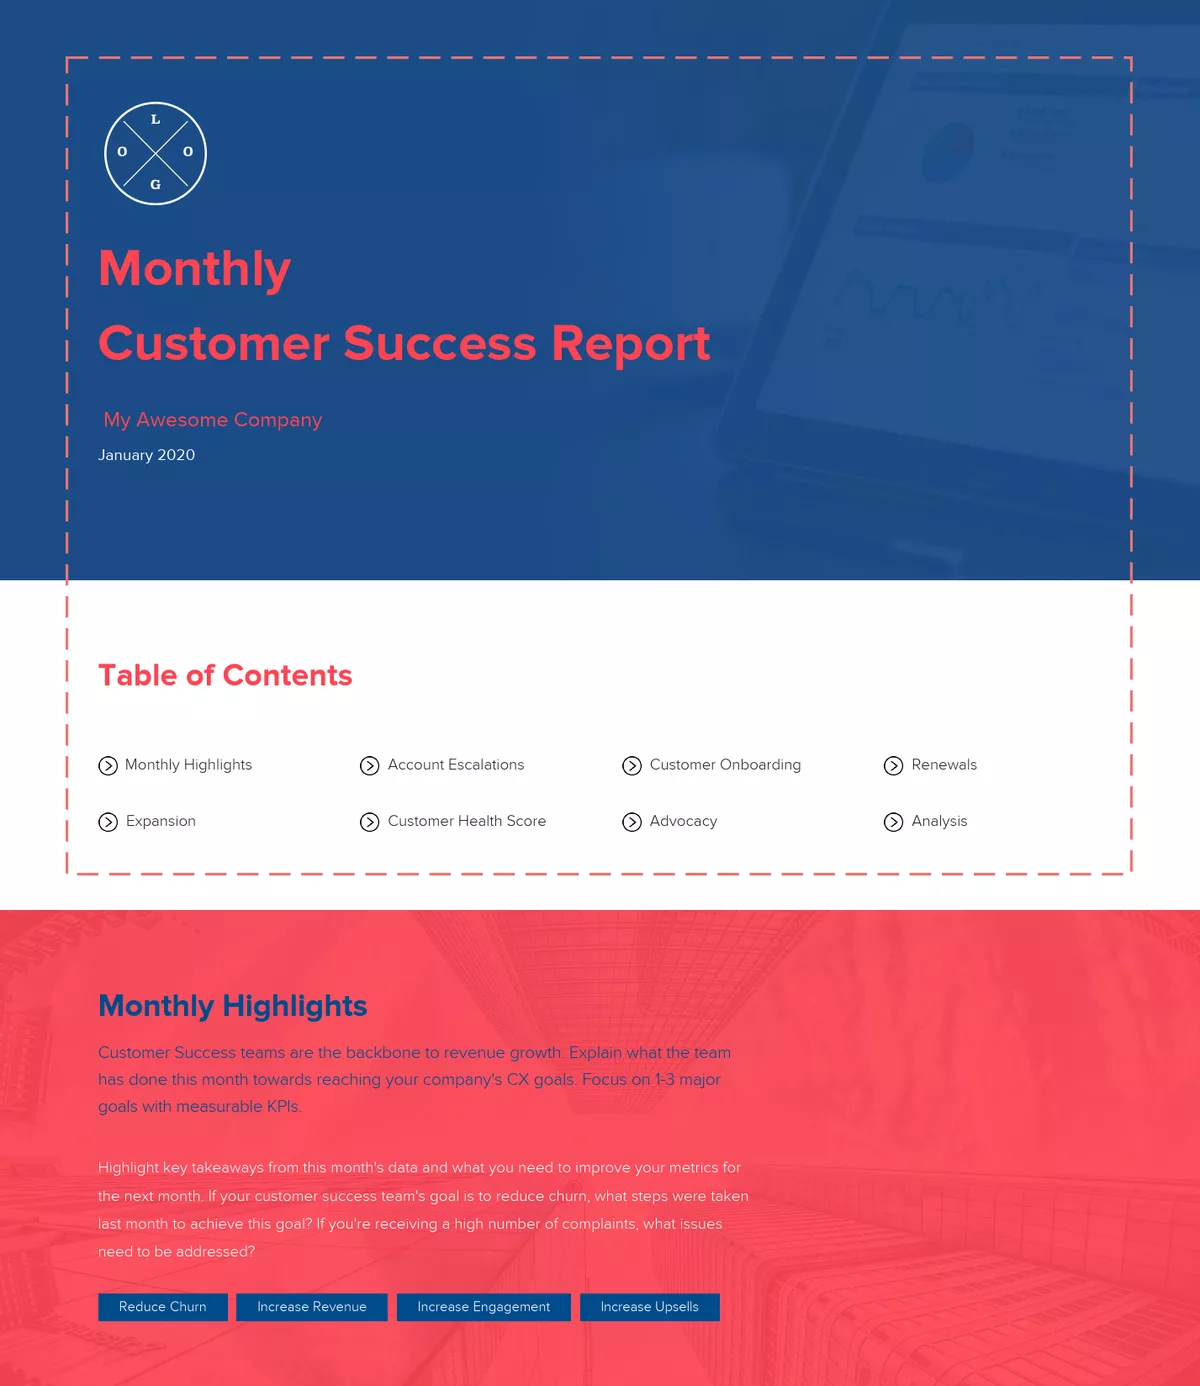
Introduce your customer success report with your company or your client’s company name and logo, add the month you’re reporting for and update the folio color scheme and background to match your company branding.
In the table of contents, list of the sections you’ll be reporting on. This could include:
- Monthly highlights
- Account escalations
- Customer onboarding and engagement
- Renewals
- Expansion
- Customer health score
- Advocacy
- Analysis
QUICK TIP: Once you set up your header section, you can save a custom template to easily repurpose for your ongoing customer success reports.
2. Highlight an overview of the overall customer success efforts and achievements
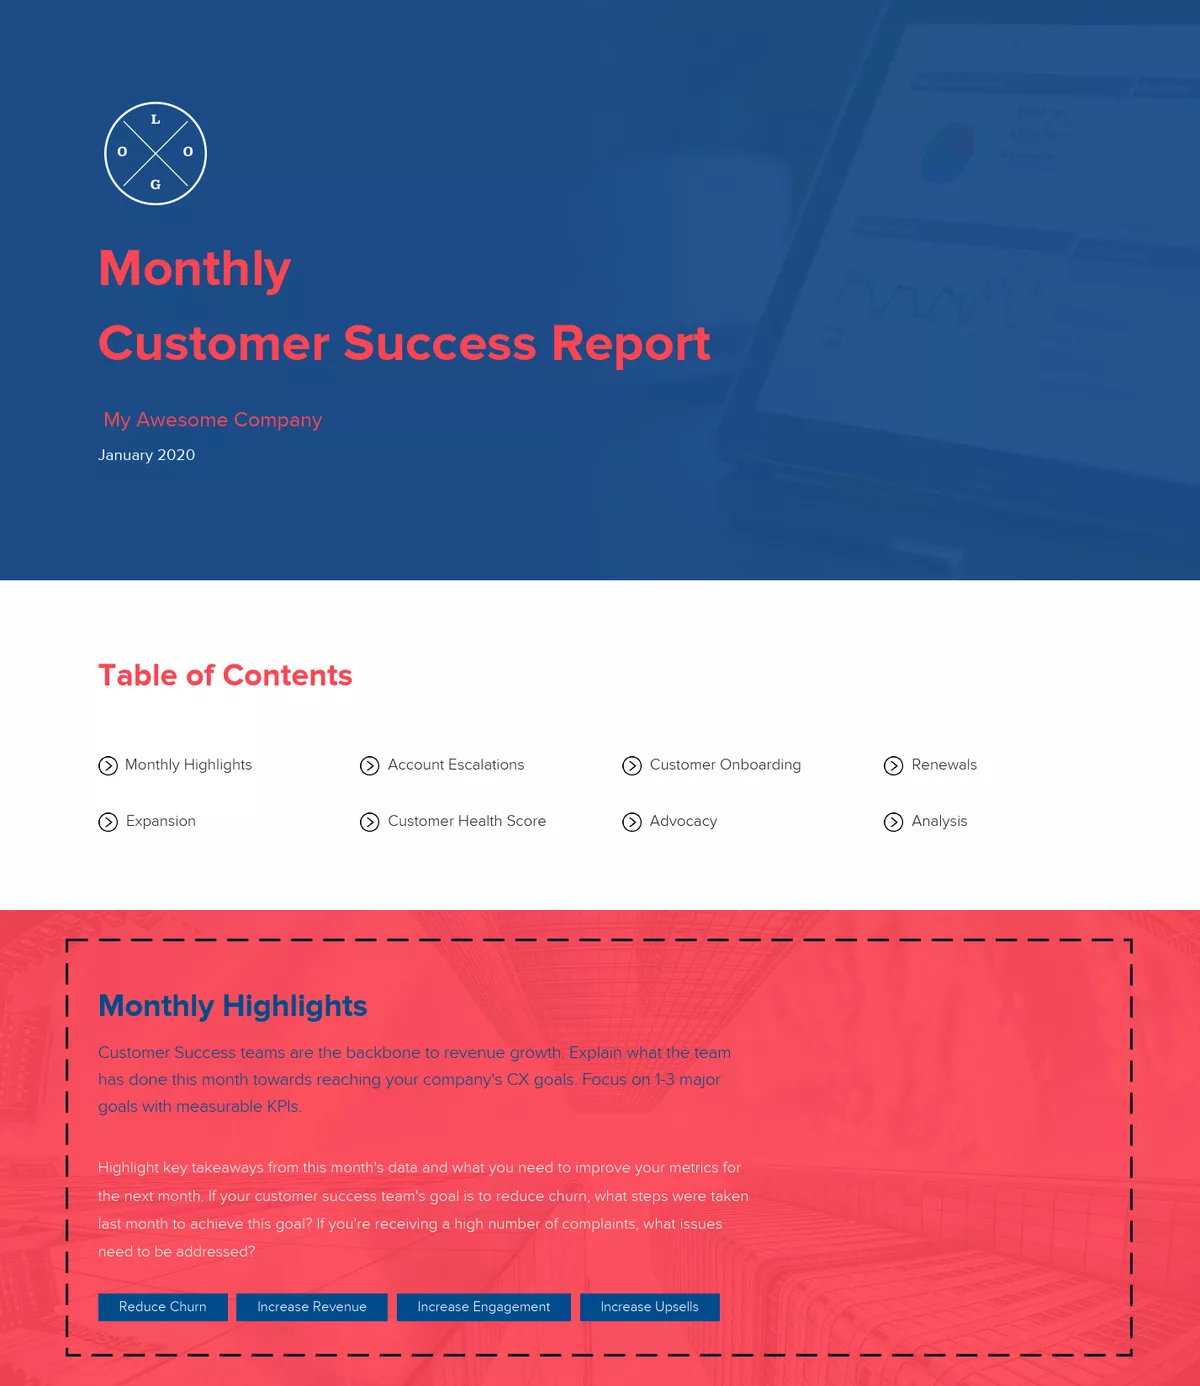
Customer Success teams are the backbone to revenue growth. Explain what the team has done this month towards reaching your company’s CX goals. Focus on 1-3 major goals with measurable KPIs.
Explain what the CS team has done this month towards reaching established metrics and KPIs. Highlight key takeaways from this month’s data and what you need to improve your metrics for the next month. If your customer success team’s goal is to reduce churn, what steps were taken last month to achieve this goal? If you’re receiving a high number of complaints, what issues need to be addressed?
Some things your success team may be focussing on:
- Reducing churn
- Increasing revenue
- Increasing product engagement
- Increasing expansion and upsells
3. Outline customer service efforts and account escalations
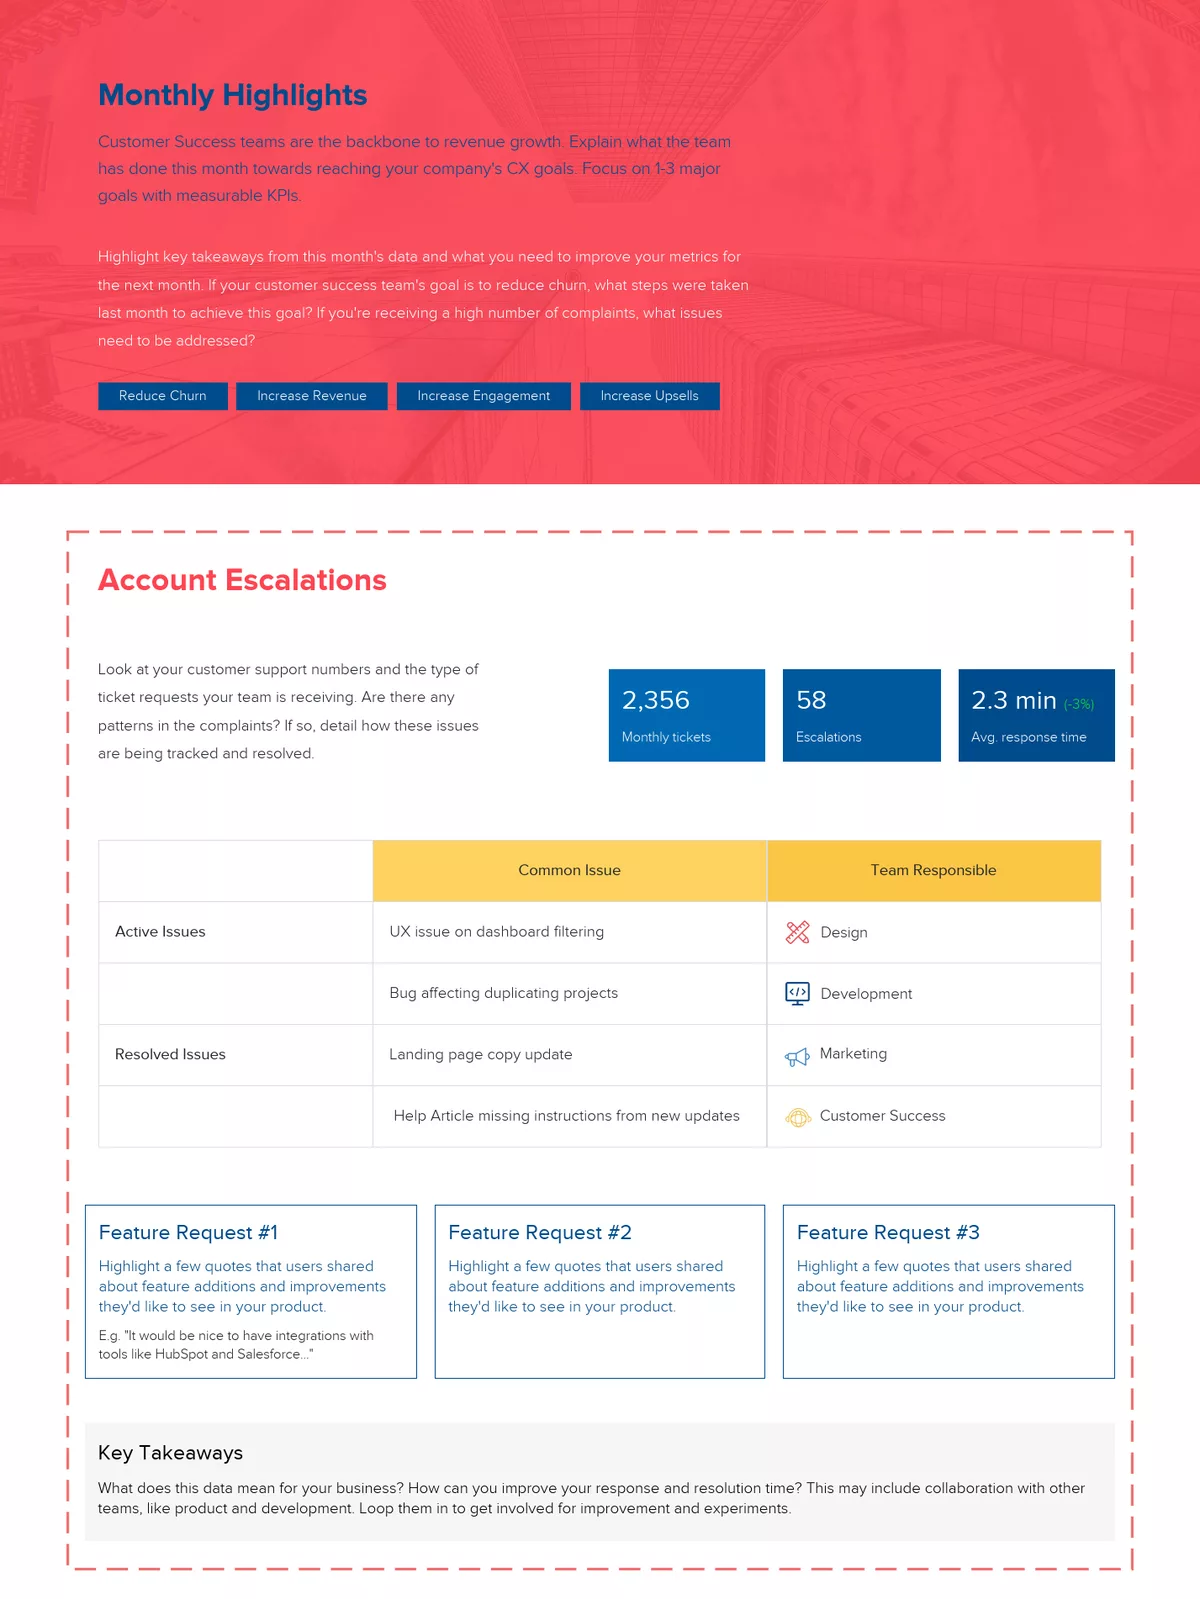
Look at your customer support numbers and the type of ticket requests your team is receiving. How do your response and resolution time affect customer satisfaction? Are there any patterns in the complaints? If so, detail how these issues are being tracked and resolved.
Highlight monthly tickets, escalations and average response time. Then create a table to indicate common issues and determine what team is responsible for these issues.
In this section, you can also call out key feature requests to help product planning. Highlight a few quotes that users shared about feature additions and improvements they’d like to see in your product.
Finally, summarize what your monthly customer service tickets and issues mean for the business. How can you improve your response and resolution time? This may include collaboration with other teams, like product and development. Loop them in to get involved for improvement and experiments.
4. Detail customer onboarding and engagement initiatives
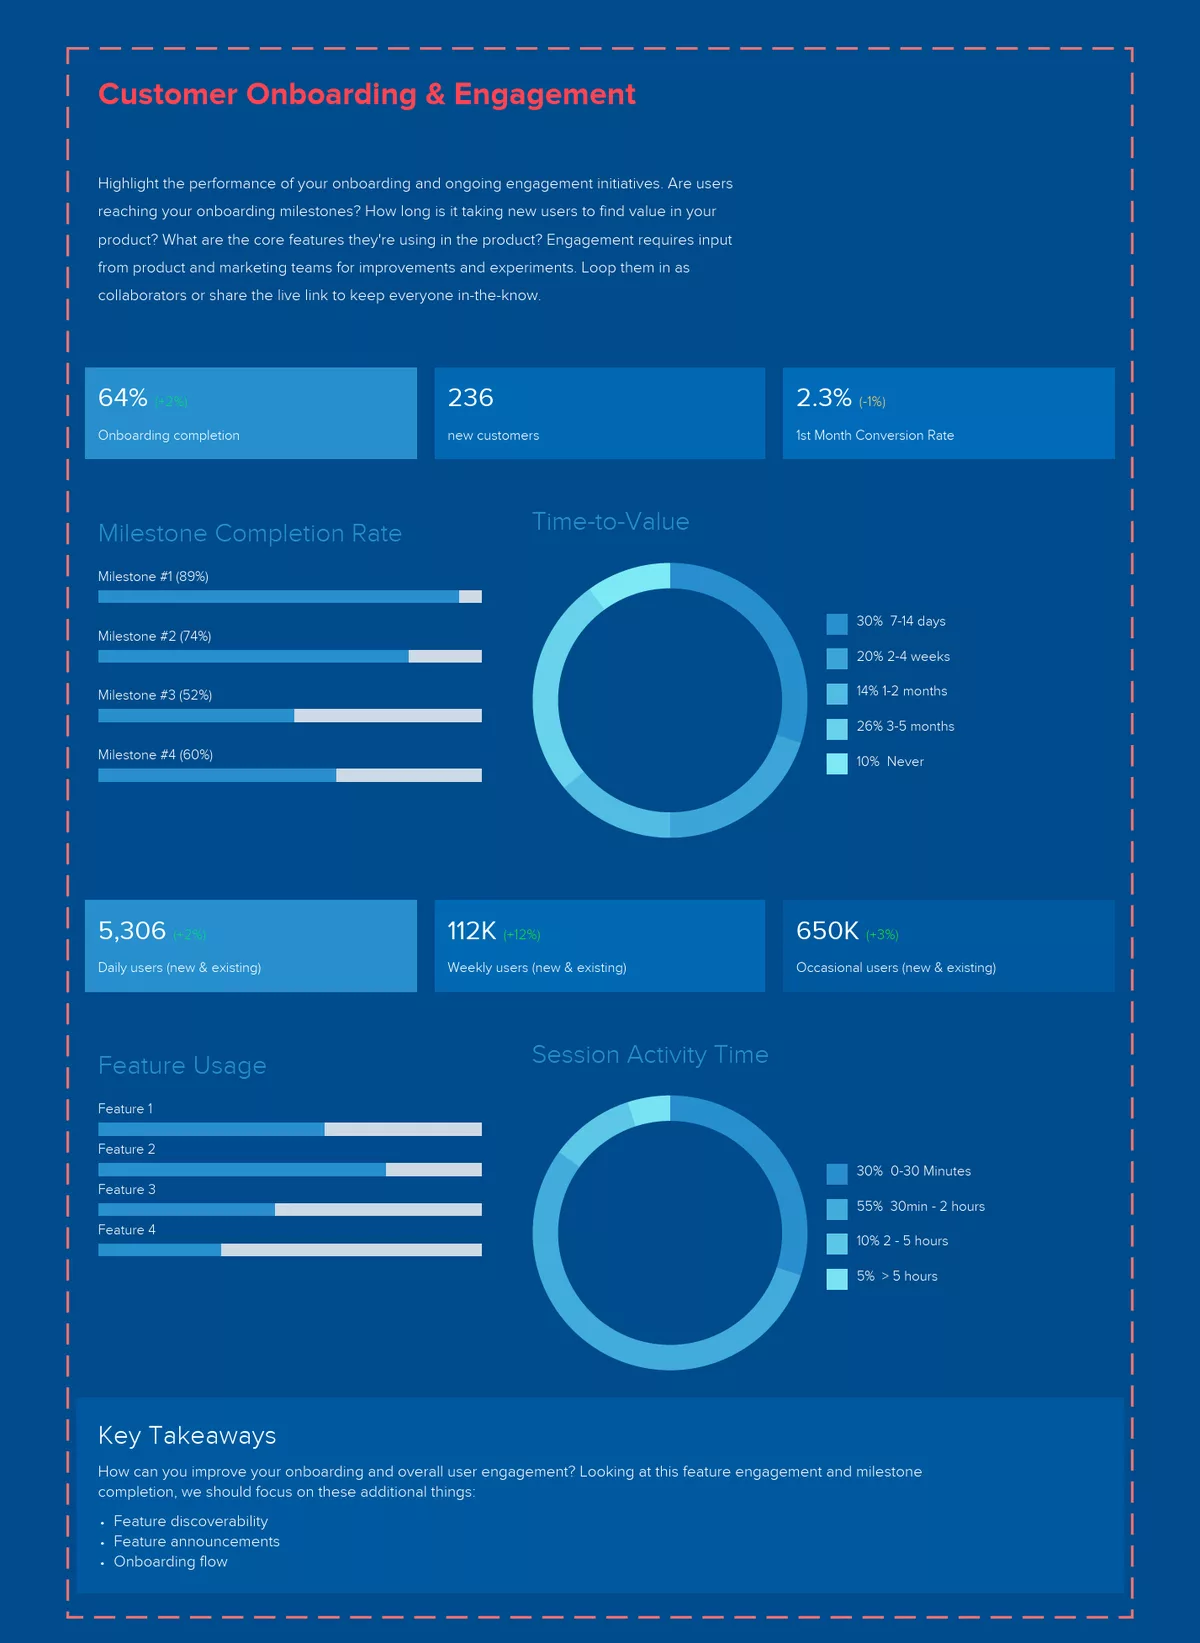
Highlight the performance of your onboarding and ongoing engagement initiatives. Are users reaching your onboarding milestones? How long is it taking new users to find value in your product? What are the core features they’re using in the product? Engagement requires input from product and marketing teams for improvements and experiments.
Use charts and graphs to detail engagement activity:
- Onboarding completion
- New customers
- Milestone completion rate
- Time-to-value
- Expansion
- Daily users
- Weekly users
- Occasional users
- Feature usage
- Session activity time
What are the key takeaways from your onboarding and engagement activity? How can you improve your onboarding and overall user engagement? Looking at this feature engagement and milestone completion, we should focus on these additional things:
- Feature discoverability
- Feature announcements
- Onboarding flow
5. Outline churn and renewal activity
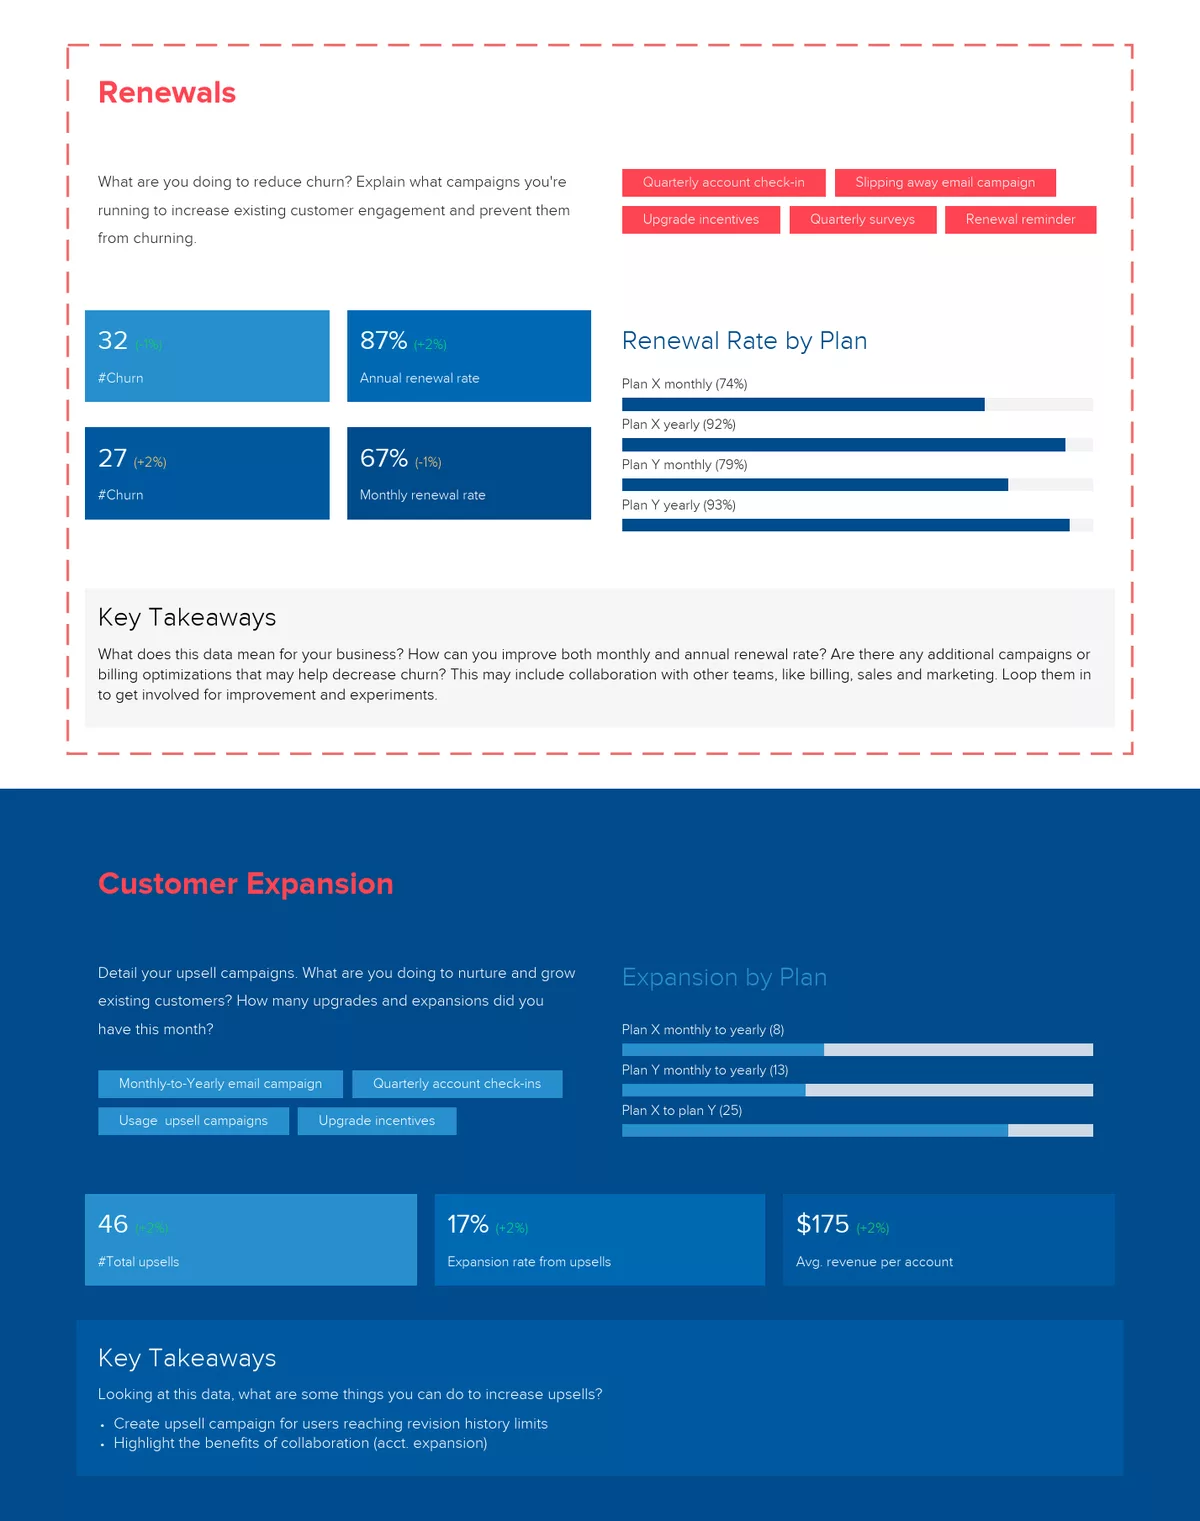
What are you doing to reduce churn? Explain what campaigns you’re running to increase existing customer engagement and prevent them from churning. This could be:
Use charts and graphs to detail engagement activity:
- Quarterly account check-ins
- Email campaigns
- Upgrade incentives
- Surveys
- Renewal reminders
What does this data mean for your business? How can you improve both monthly and annual renewal rate? Are there any additional campaigns or billing optimizations that may help decrease churn? This may include collaboration with other teams, like billing, sales and marketing.
6. Summarize your customer expansion data
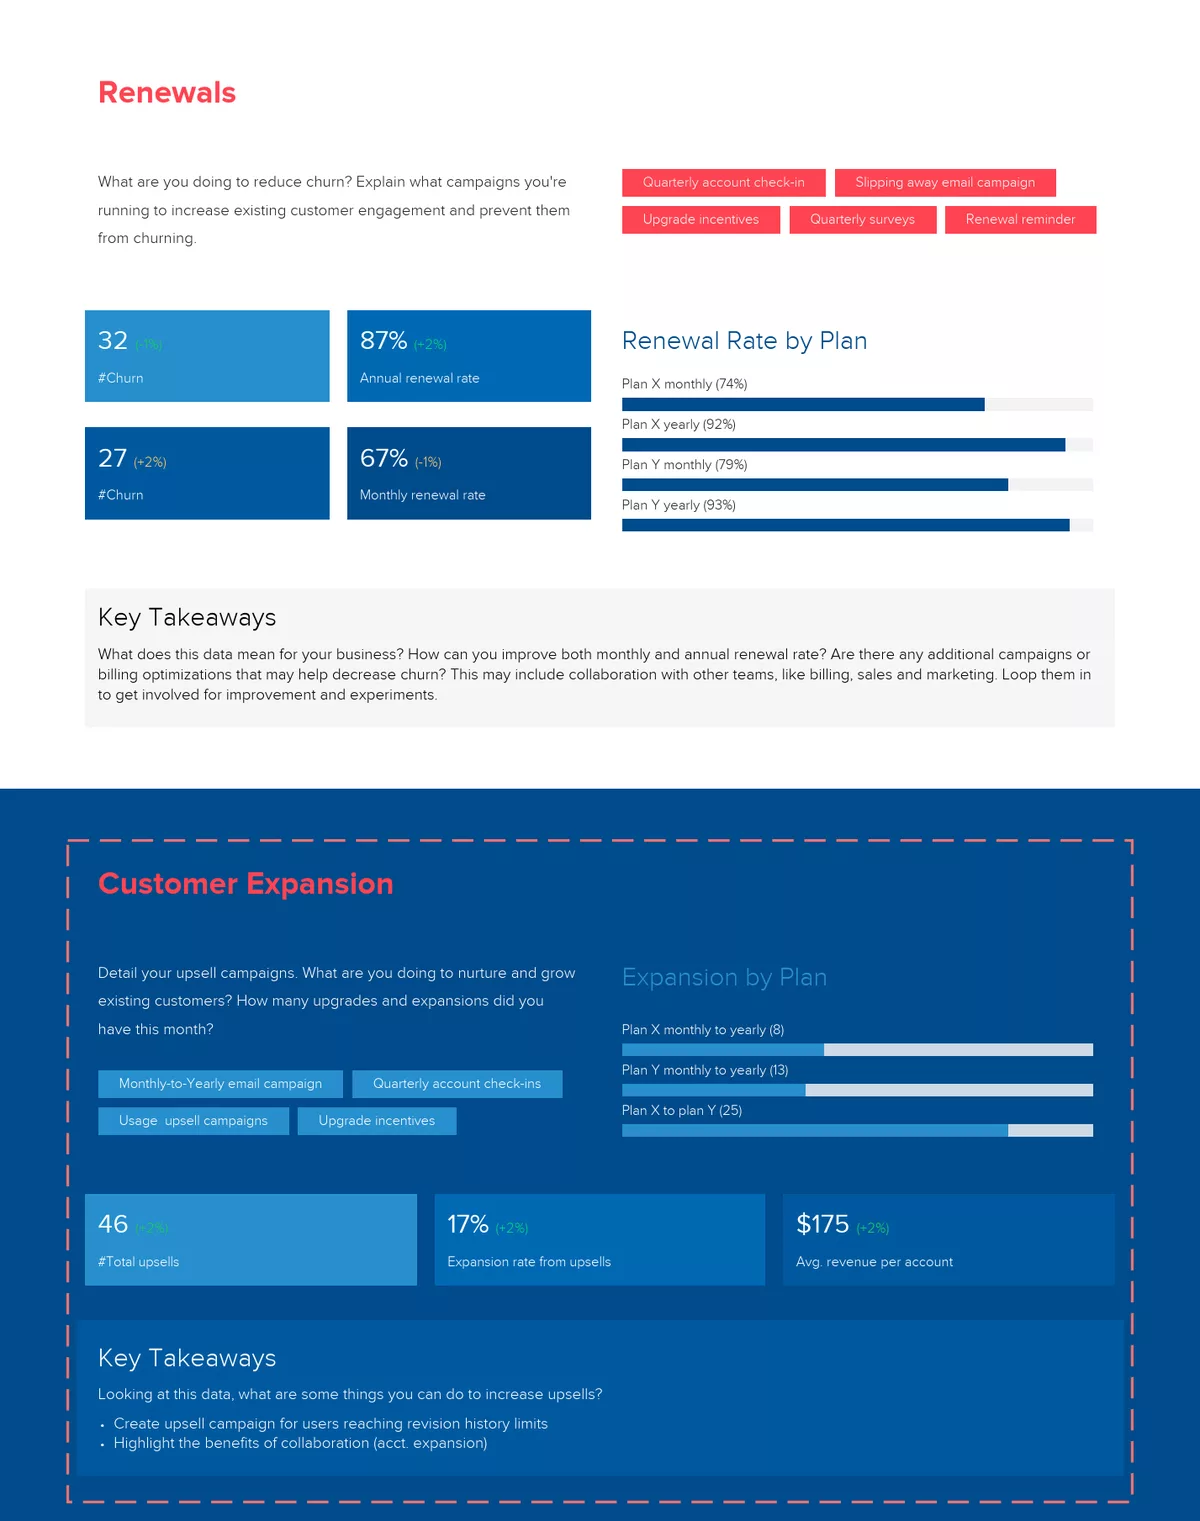
Detail your upsell campaigns. What are you doing to nurture and grow existing customers? How many upgrades and expansions did you have this month?
- Monthly-to-Yearly email campaign
- Quarterly account check-ins
- Usage-based upsell campaigns
- Upgrade incentives
Use charts and graphs to visualize customer expansion data, like upgrading plans, adding users or upgrading from monthly to yearly. Then list the total number of upsells, expansion rate and average revenue per account. Looking at this data, what are some things you can do to increase upsells?
7. Calculate the customer health score
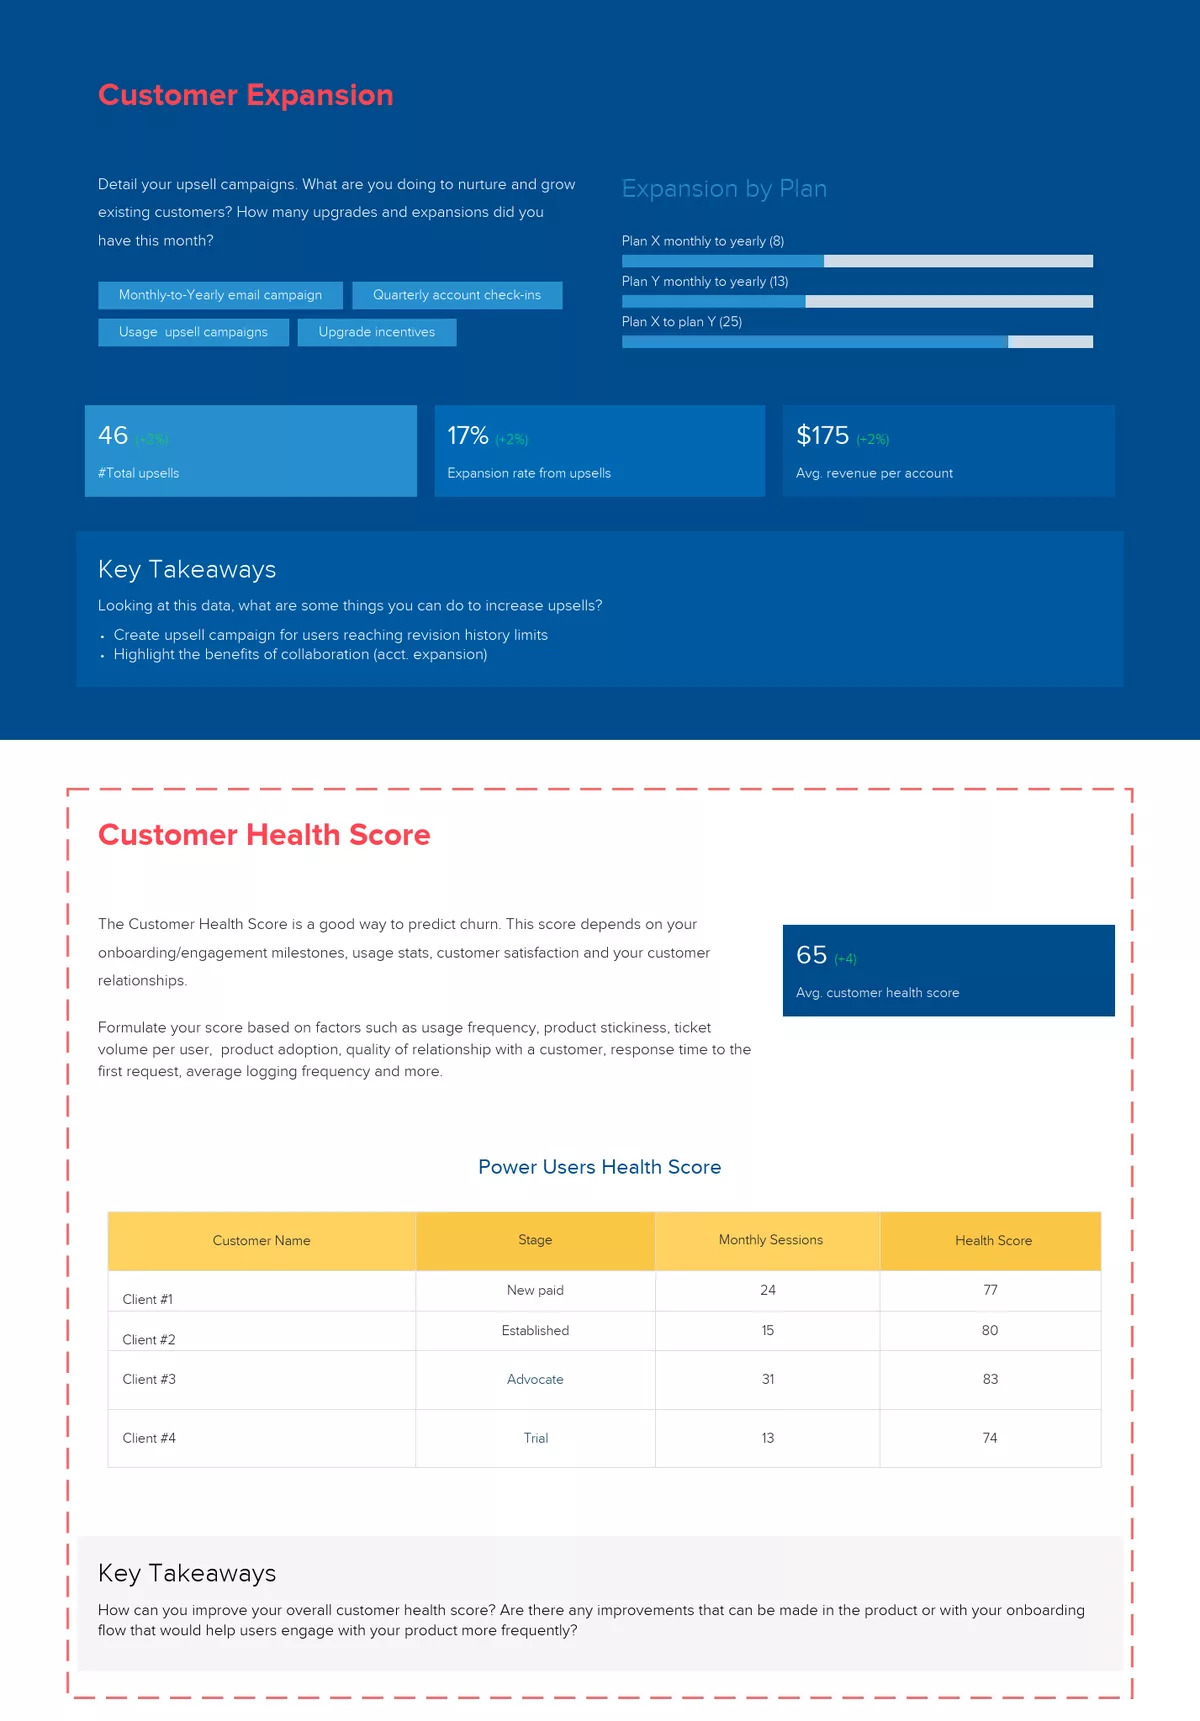
The Customer Health Score is a good way to predict churn. This score depends on your onboarding/engagement milestones, usage stats, customer experience, customer satisfaction, and customer relationships.
Formulate your score based on factors such as usage frequency, product stickiness, ticket volume per user, product adoption, quality of relationship with a customer, response time to the first request, average logging frequency and more.
Then create a table to detail your power users health score to go more in-depth about the average customer health score. Looking ta this data, how can you improve your overall customer health score? Are there any improvements that can be made in the product or with your onboarding flow that would help users engage with your product more frequently?
8. Detail customer advocacy efforts and achievements
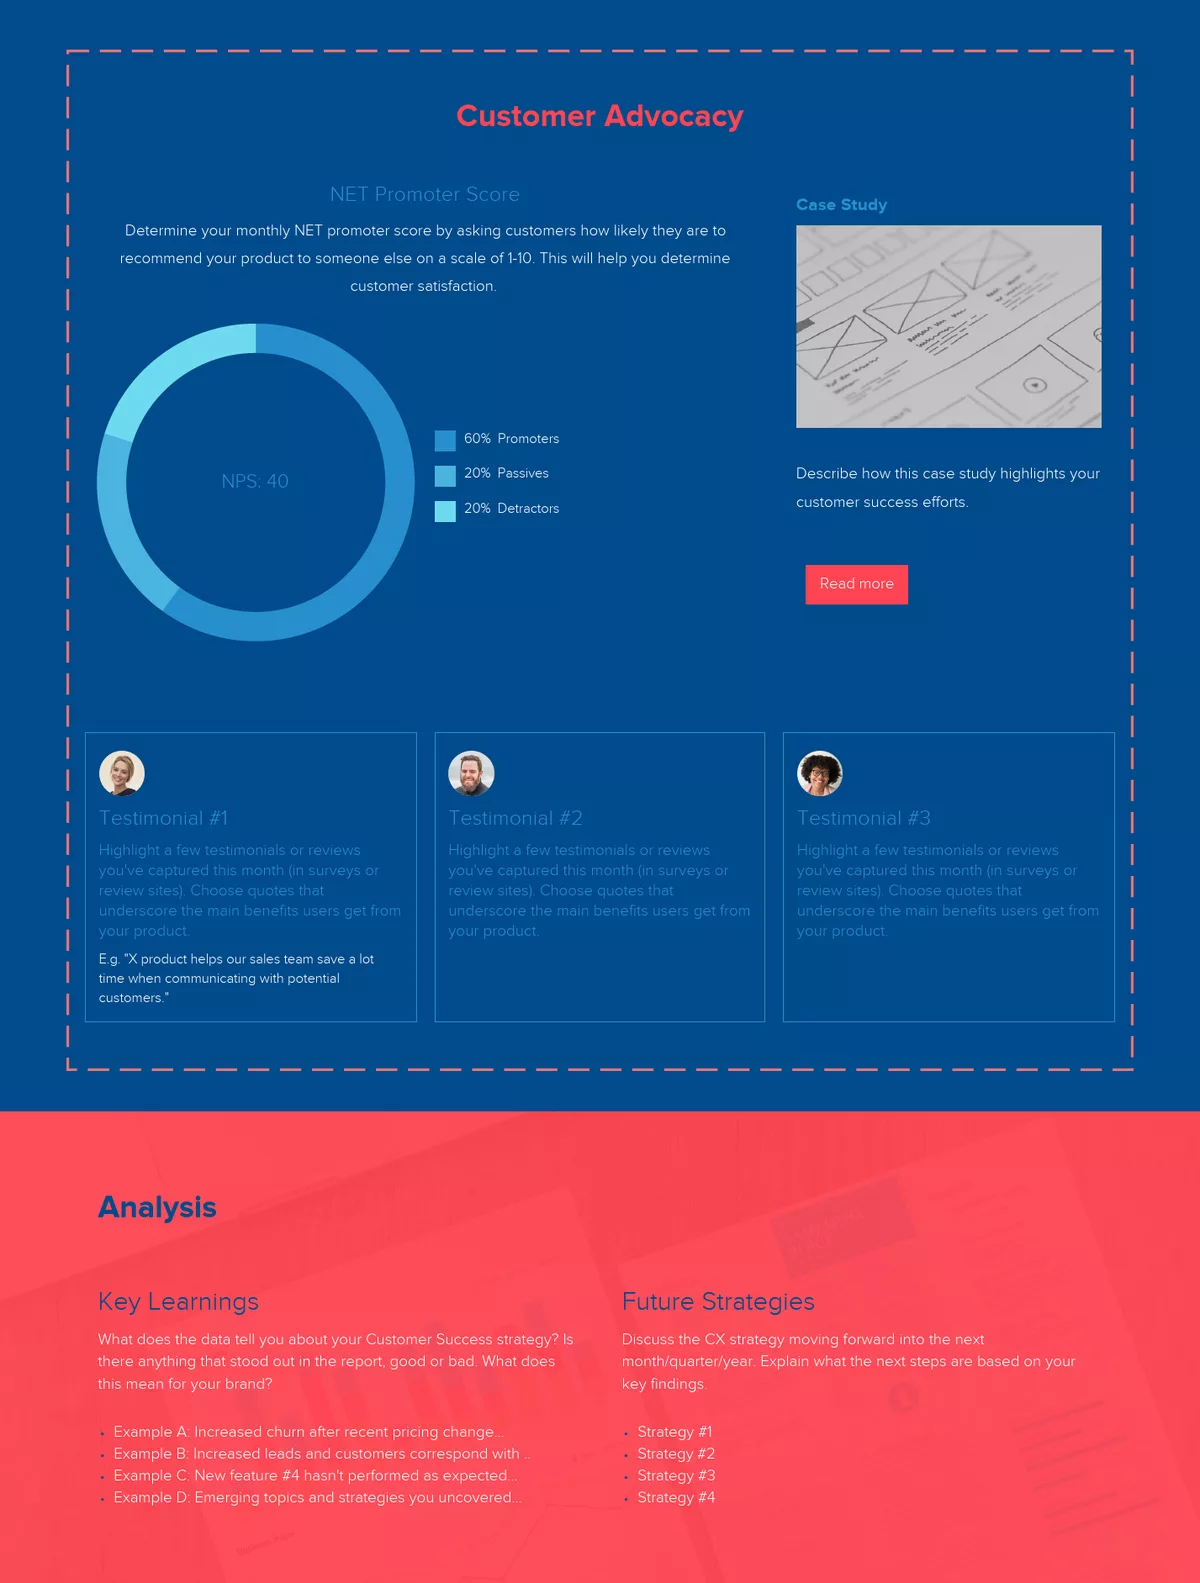
Use surveys to determine your monthly NET promoter score by asking customers how likely they are to recommend your product to someone else on a scale of 1-10. This will help you determine customer satisfaction.
This section can also be used to highlight new case studies and testimonials you’ve gathered this month. Describe how your case study aligns with your customer success efforts.
Highlight a few testimonials or reviews you’ve captured this month (in surveys or review sites). Choose quotes that underscore the main benefits users get from your product. E.g. “X product helps our sales team save a lot time when communicating with potential customers.”
9. Analyze your customer success efforts and accomplishments
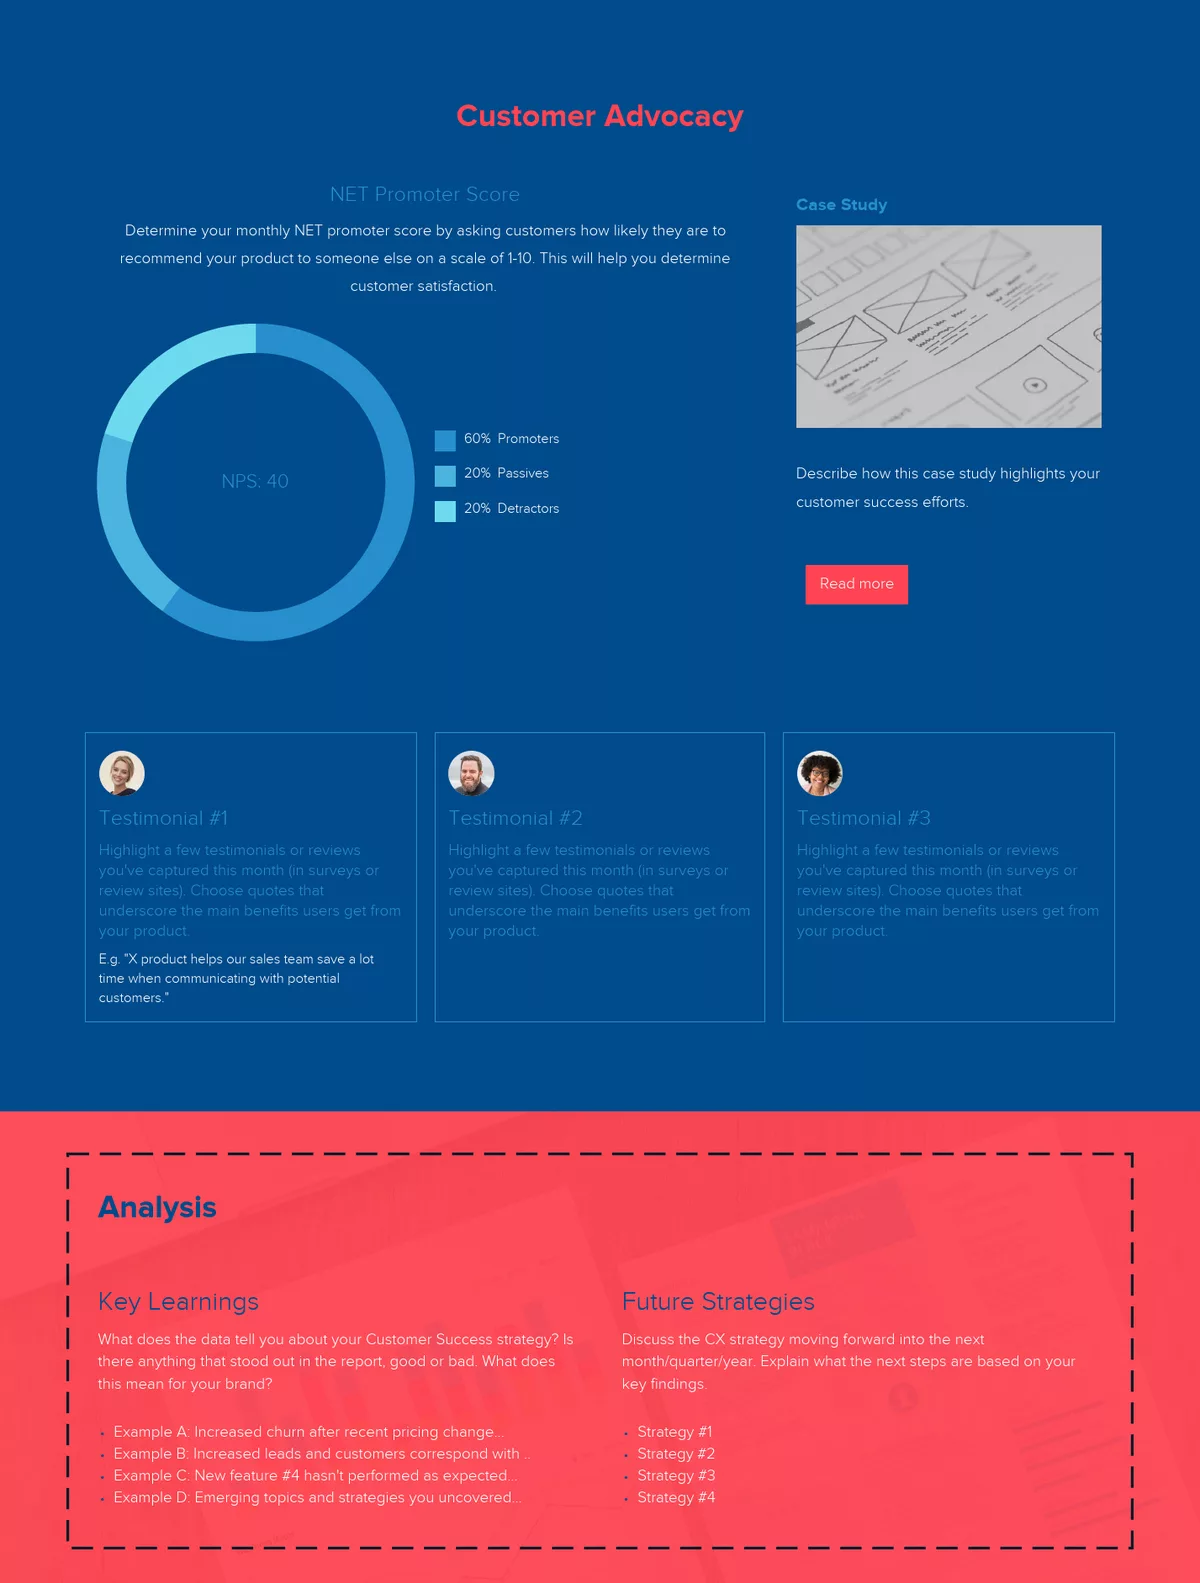
What does the data tell you about your Customer Success strategy? Is there anything that stood out in the report, good or bad. What does this mean for your brand?
- Example A: Increased churn after recent pricing change…
- Example B: Increased leads and customers correspond with …
- Example C: New feature #4 hasn’t performed as expected…
- Example D: Emerging topics and strategies you uncovered…
Discuss the CS strategy moving forward into the next month/quarter/year. Explain what the next steps are based on your key findings.
Share your customer success report as a link, monitor, evaluate & iterate on your CS strategy
When you’ve finished creating your customer success report with Xtensio’s editor, you can send the live link to share it as a responsive webpage (and add password protection), export a PDF and post it on your bulletin board and continuously optimize with new learnings. The customer success report template is adaptable just like other Xtensio tools, it can and should be repurposed, revisited, and revised regularly.
Written by

Design, manage and share beautiful living documents… easily, together. Explore Xtensio
- Click and edit anything… together.
- Customize to match your branding.
- Share with a link, present, embed or download.
Customer Success Report vs Account Review vs QBR
Customer success teams juggle several recurring documents that overlap in name but serve different audiences and purposes. Knowing which one to use, and when, prevents wasted effort and ensures each conversation achieves the right outcome.
Customer success report. This is an internal document that tracks the health and performance of your customer portfolio. It is written for your CS leadership, product team, and executives. The report aggregates metrics across accounts (retention rate, expansion revenue, NPS trends, support ticket volume, feature adoption) and highlights patterns: which segments are thriving, which are at risk, and what actions the team is taking. Customer success reports are typically monthly or weekly and drive internal resource allocation and strategy decisions.
Account review. An account review is a client-facing conversation (usually one-on-one) where you discuss the relationship, review progress against the client’s goals, and address any concerns. Account reviews are less formal than QBRs and happen more frequently, often monthly or even biweekly for high-touch accounts. The purpose is relationship maintenance: making sure the client feels heard, surfacing small issues before they become big ones, and reinforcing the value your product delivers.
Quarterly Business Review (QBR). A QBR is a structured, strategic meeting with key stakeholders on the client side, typically including the executive sponsor. It covers the previous quarter’s performance data, ROI analysis, a forward-looking roadmap, and recommendations for expanding usage or adopting new features. QBRs require significant preparation: polished slides, data visualization, and specific recommendations tailored to the account’s goals. They are the highest-stakes CS touchpoint and often influence renewal and expansion decisions.
The three work together: customer success reports inform which accounts need attention, account reviews maintain day-to-day relationship health, and QBRs drive strategic alignment at the executive level. Build each using the customer success report template as your starting structure, then adapt the format for internal (report) vs. client-facing (review/QBR) audiences. Share client-facing versions as live links so the client can reference the data between meetings.
Metrics That Predict Churn Before It Happens
By the time a customer announces they are leaving, the decision was made weeks or months earlier. The best customer success teams do not wait for cancellation notices. They track leading indicators that reveal disengagement long before the renewal conversation.
Login frequency decline. This is the earliest and most reliable signal. When a previously active user drops from daily logins to weekly, or weekly to monthly, something has changed. It could be a workflow shift, a competitor trial, or simple loss of perceived value. Track login frequency per account over rolling 30-day windows. A 40% or greater decline from the account’s baseline warrants immediate outreach, not a scheduled check-in.
Support ticket increase. A sudden spike in support tickets, especially from a previously self-sufficient account, signals frustration. Pay close attention to the type of tickets: questions about features that already work indicate training gaps, while complaints about bugs or missing functionality indicate product-market fit erosion. Three or more tickets in a week from the same account is a churn risk flag.
Feature adoption stalls. Healthy accounts progressively adopt more features over time. When an account stops exploring new capabilities after the initial onboarding period, it usually means they have hit a ceiling of perceived value. Track the number of distinct features used per account per month. If it plateaus within the first 90 days, proactive enablement sessions can restart adoption before the account decides your product “only does one thing.”
NPS or satisfaction score drops. A single low NPS score is noise. Two consecutive drops are a trend. Track NPS at the account level (not just aggregate) and flag any account that drops two or more points between surveys. More importantly, read the verbatim comments. A score of 7 with a comment about “looking at alternatives” is far more urgent than a score of 5 with a comment about a minor UI annoyance.
Expansion revenue flatline. In SaaS and subscription businesses, healthy accounts expand over time: more seats, higher tiers, add-on purchases. When an account that was previously growing stops expanding, it often means the internal champion has lost influence, the budget has been questioned, or a competitor is being evaluated. Track expansion revenue per account quarterly. Zero expansion for two consecutive quarters on a growth-stage account is a warning sign worth investigating.
Build a simple early warning dashboard that tracks these five metrics per account. Use engagement analytics to see which reports and deliverables each account actually views, and organize all account health data in dedicated workspaces so your CS team can spot patterns quickly without switching between tools.

Create and deliver beautiful work, professionally.
Build, brand, and deliver living documents your clients actually engage with.







Join 407,368 professionals delivering work with Xtensio.
Related reports: Monthly Performance Report Template
Related reports: Monthly Performance Report Template