How To Create A Monthly Marketing Report (With Template & Examples)
Updated by Xtensio
A monthly marketing report is essential to the success of any company’s marketing process. However, it doesn’t need to be a tedious task every month. Keep an ongoing record of your marketing efforts, measure the impact of strategic marketing initiatives and long-term projects, and make more informed business decisions by creating your own monthly marketing reports. Use this step-by-step guide to create and iterate your monthly marketing reports, easily. Explore this template.
Xtensio is your team space for beautiful living documents.
Create, manage and share business collateral, easily.
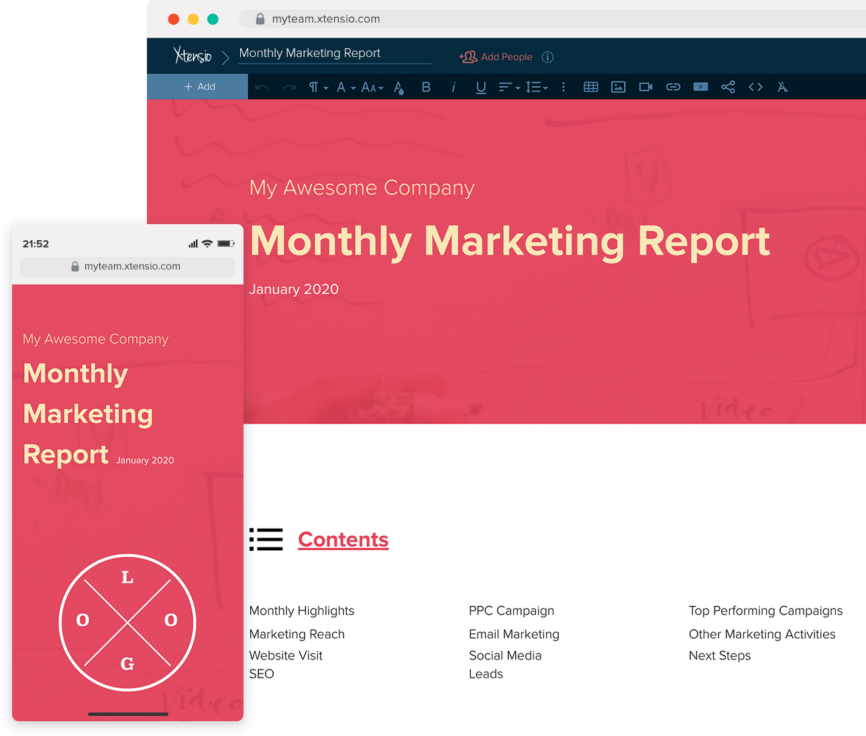
Table of Contents
What is a marketing report?
The monthly marketing report includes information that will help shape your marketing strategy. This means it’s crucial to choose your metrics wisely and make sure they are closely connected to the business’s goals as a whole. Monthly reporting will help your marketing team:
- Create a visually-engaging report to track monthly growth of your visits, leads, and customers.
- Identify which marketing channels perform best for your organization.
- Find holes in your marketing strategy, pivot and improve.
With Xtensio, you can easily generate your marketing reports tailored to your (or your client’s) marketing objectives. Loop in colleagues, clients and key stakeholders to create and iterate on your marketing reports. You can work hand-in-hand with colleagues on a live doc, leave feedback, and share a link so everyone is updated on the status of your marketing process, KPIs, and objectives.
Create your marketing report header and table of contents
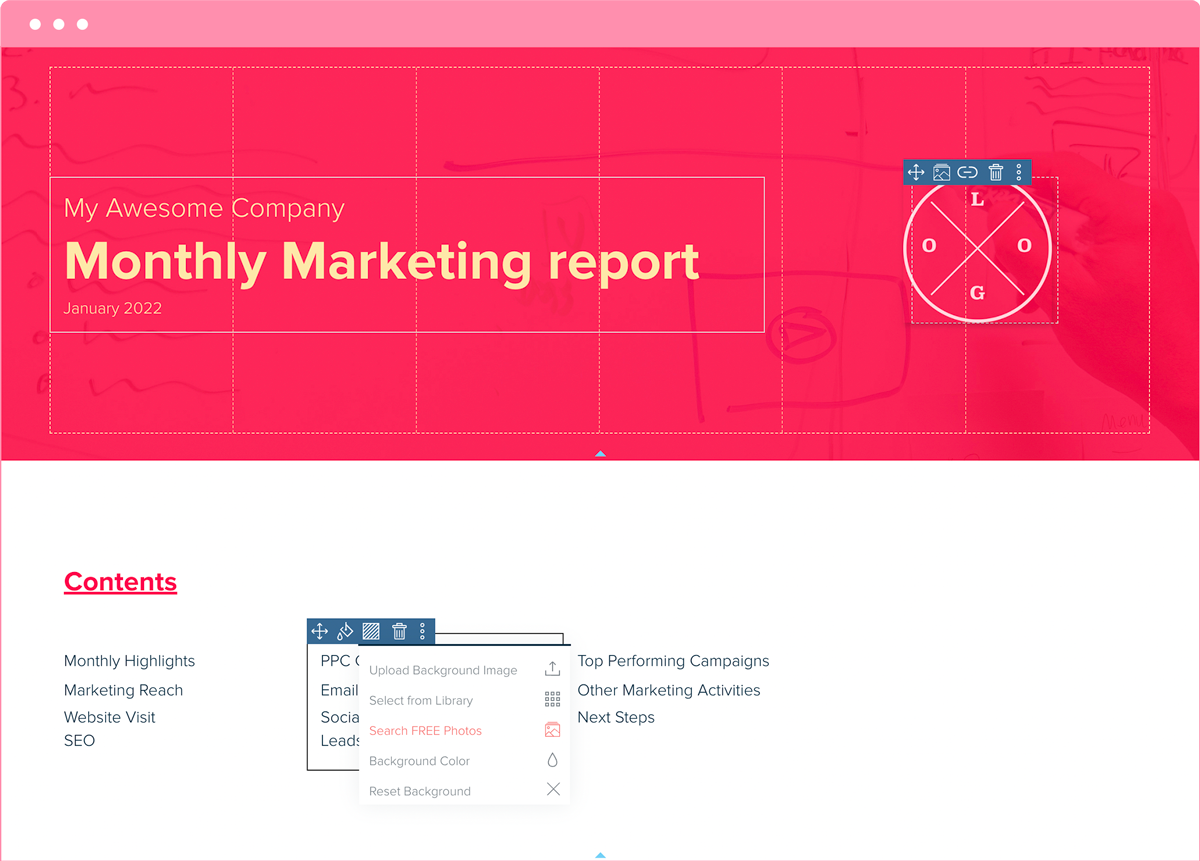
Introduce your marketing report with your company or your client’s company name and logo, add the month you’re reporting for and update the folio color scheme and background to match your company branding.
Next, create a section outlining the different contents of your marketing report. The specific metrics you choose to report on will depend on your marketing goals, but here is a list of items most marketing reports should include:
- Marketing Goals and KPIs
- SEO data and website visitors
- Email marketing data
- Paid ads and campaign (PPC) stats
- Leads and customers
- Social media analysis
- Key learnings and future strategies
QUICK TIP: Once you set up your header section, you can save a custom template to easily repurpose for your ongoing marketing reports.
Highlight your monthly marketing accomplishments and main KPIs
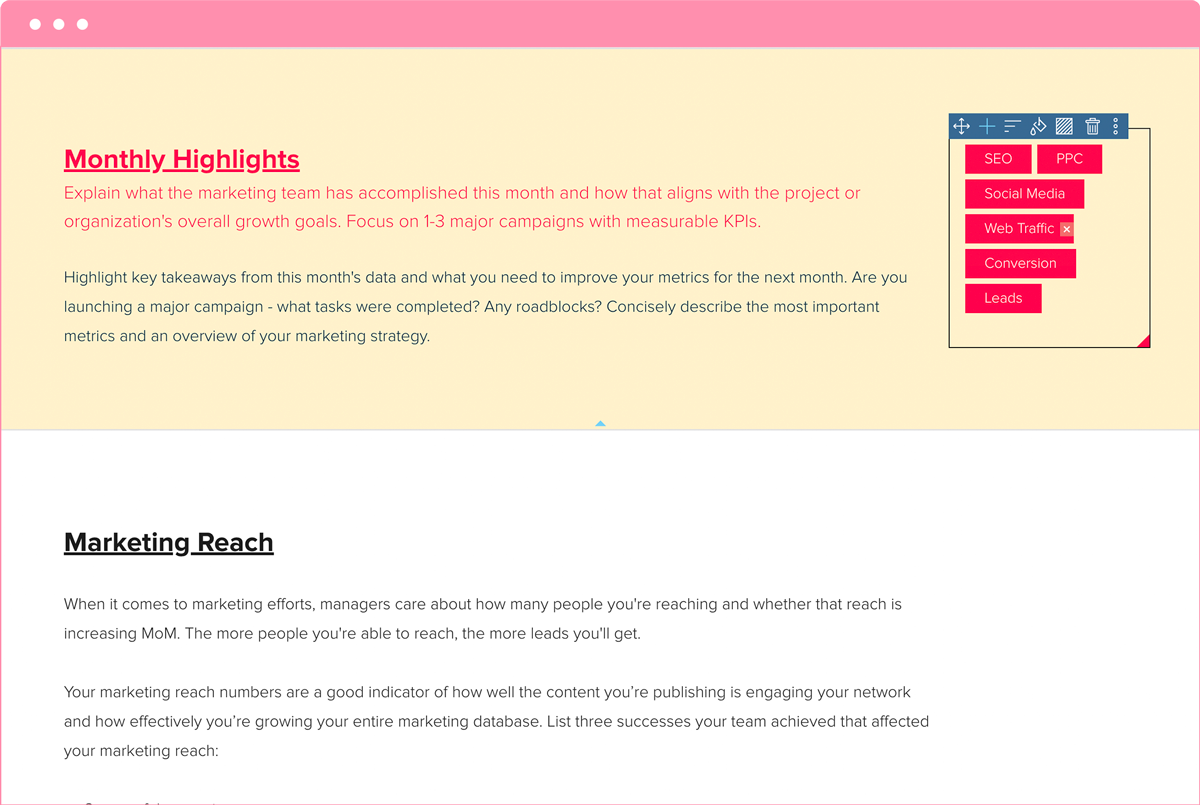
Explain what the marketing team has accomplished this month and how that aligns with the project or organization’s overall growth goals. Highlight key takeaways from this month’s data and what you need to improve your metrics for the next month.
Are you launching a major campaign – what tasks were completed? Any roadblocks? Concisely describe the most important metrics and an overview of your marketing strategy.
Your most important metrics are those that will report on your key performance indicators (KPIs). Focus on 1-3 major campaigns with measurable KPIs. These will vary by the report and by the audience. If you aren’t sure what the core KPIs should be, you need to ask. If there is no one to ask, you need to recommend KPIs based on your client or company objectives and business goals and get agreement on these from the onset of a campaign.
Detail this month’s marketing reach
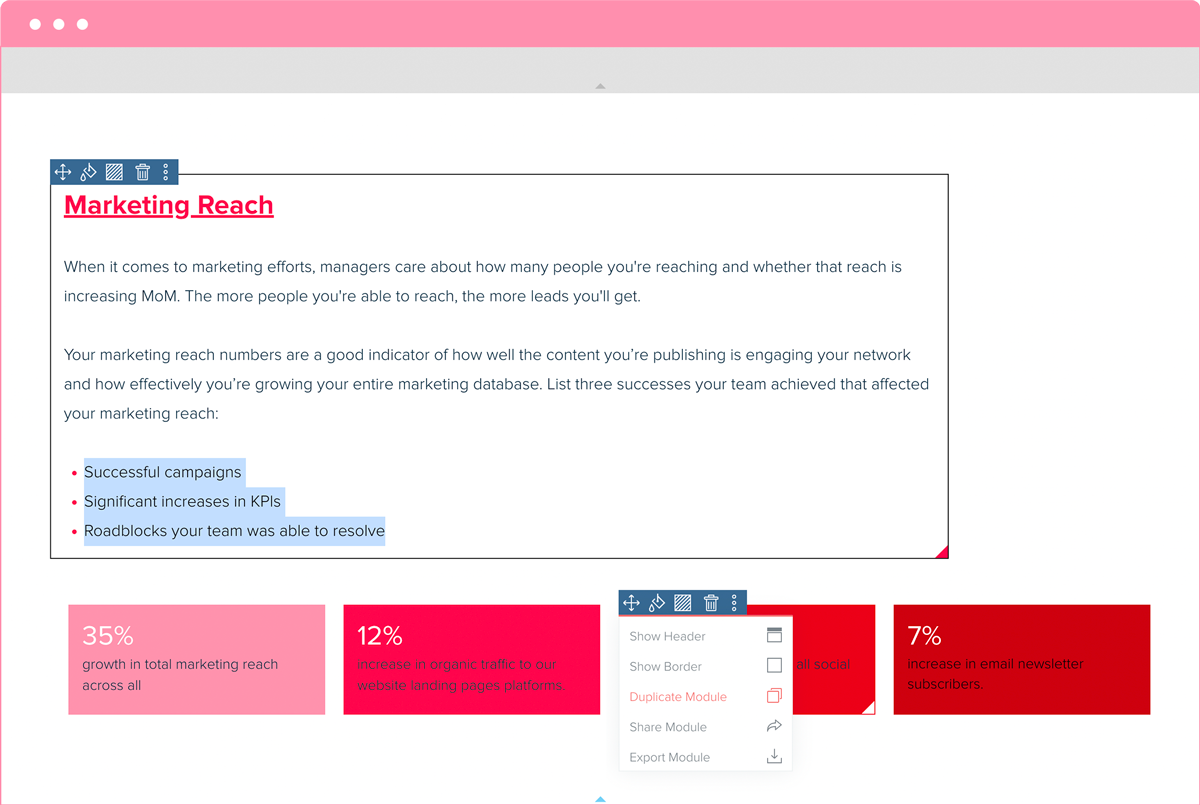
When it comes to marketing efforts, managers care about how many people you’re reaching and whether that reach is increasing MoM. The more people you’re able to reach, the more leads you’ll get.
Your marketing reach metrics are a solid measure of how well your content game is engaging your audience and how well you’re developing your complete marketing database. List three successes your team achieved that affected your marketing reach:
- Successful campaigns
- Significant increases in KPIs
- Roadblocks your team was able to resolve
KPIs are important to see growth and impact. Think of the KPIs you set in the last section and highlight important numbers related to your marketing reach. For example:
- Growth in total marketing reach across all platforms
- Increase in organic traffic to our website landing pages
- Follower increase across all social media channels
- Increase in email newsletter subscribers
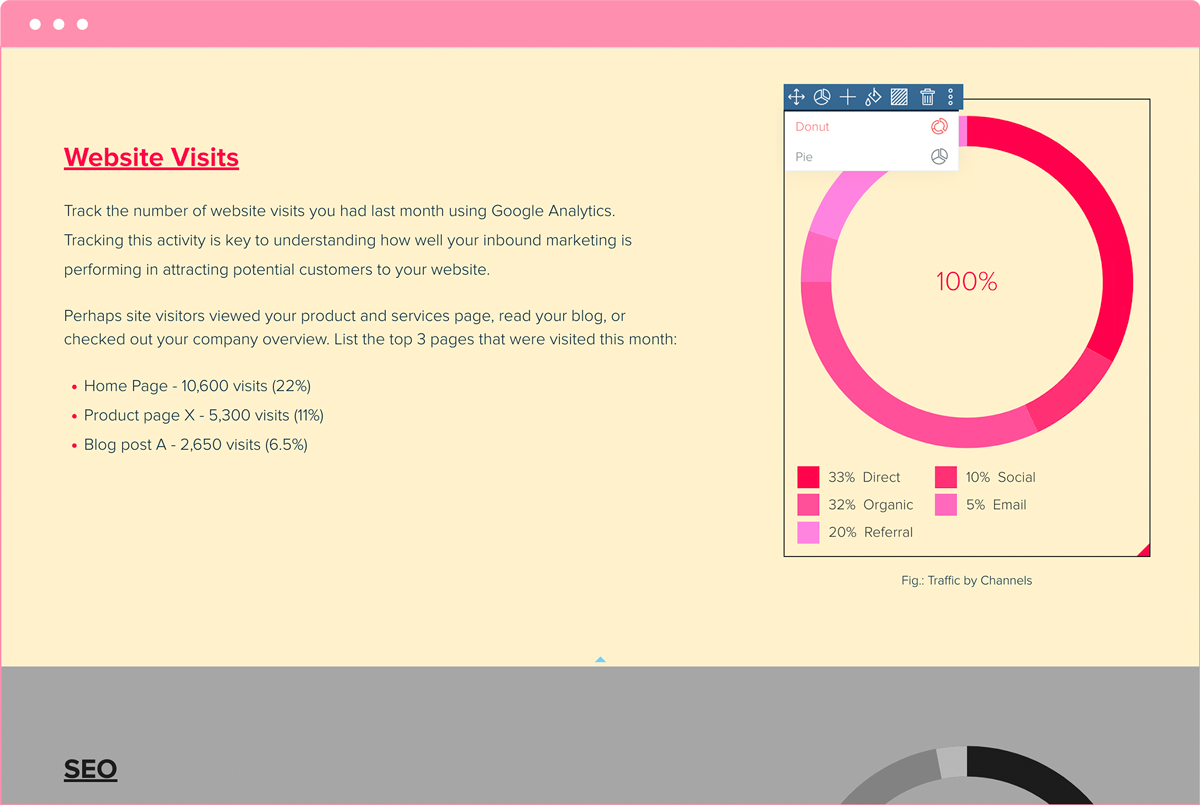
Track your website traffic
Using Google Analytics or another tracking tool, look at your website visitors. Tracking this activity is key to understanding how well your inbound marketing is performing in attracting potential customers to your website.
Perhaps site visitors viewed your product and services page, read your blog, or checked out your company overview. List the top 3 pages that were visited this month:
- Home Page – 10,600 visits (22%)
- Product page X – 5,300 visits (11%)
- Blog post A – 2,650 visits (6.5%)
Use the pie chart (or another chart/graph module) to visualize your site traffic and segmentation.
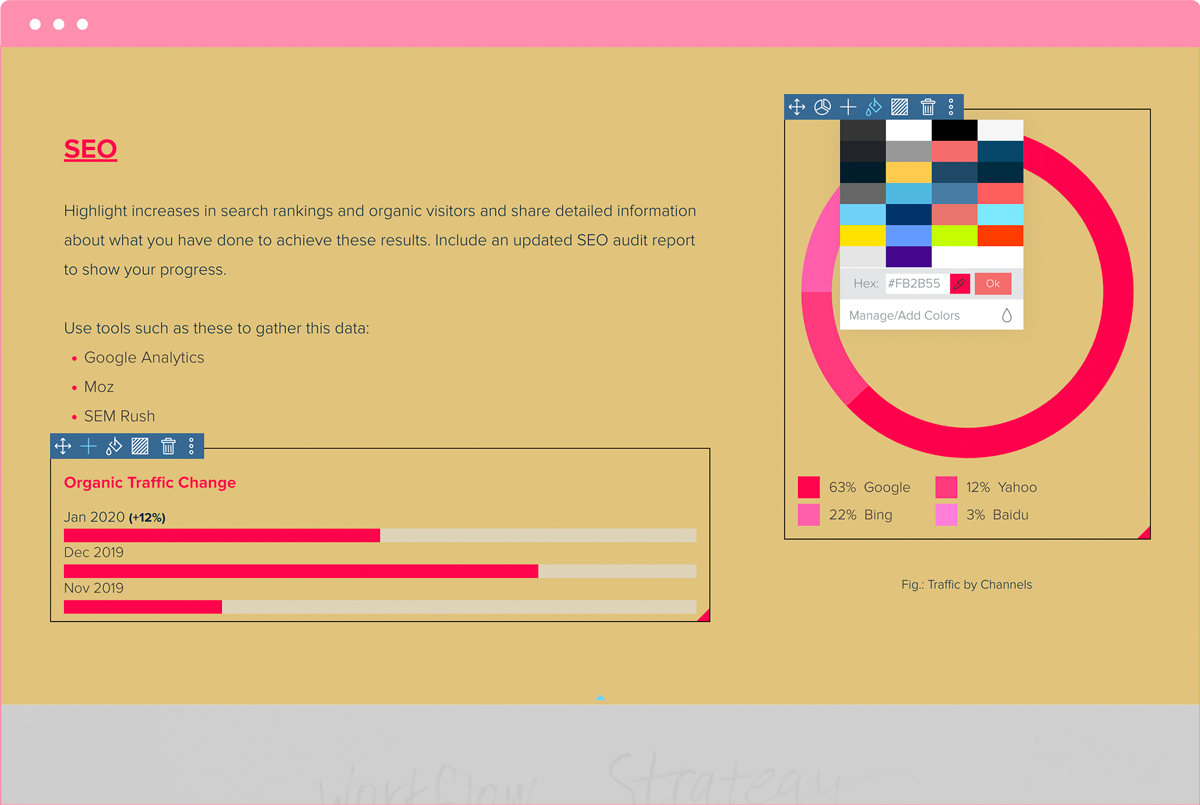
Highlight increases in SEO search ranking and organic visitors to your website
Share detailed information about what you have done to achieve these results. Use analytics tools such as these to gather this data:
- Google Analytics
- Moz
- SEM Rush
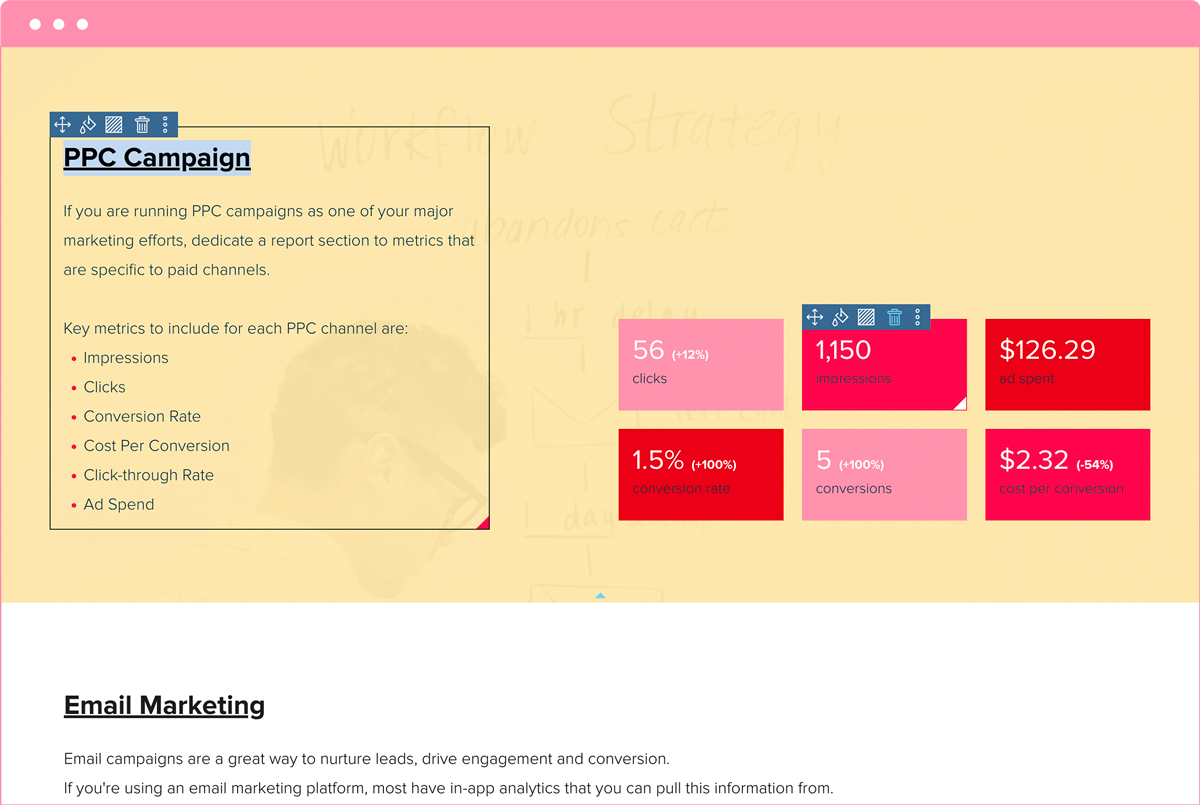
Dedicate a reporting section to paid channel metrics
If you are running PPC campaigns as one of your major marketing efforts, dedicate a report section to metrics that are specific to paid channels.
Key metrics to include for each PPC channel are:
- Impressions
- Clicks
- Conversion Rate
- Cost Per Conversion
- Click-through Rate
- Ad Spend
Use the pie chart (or another chart/graph module) to visualize your site traffic and segmentation.
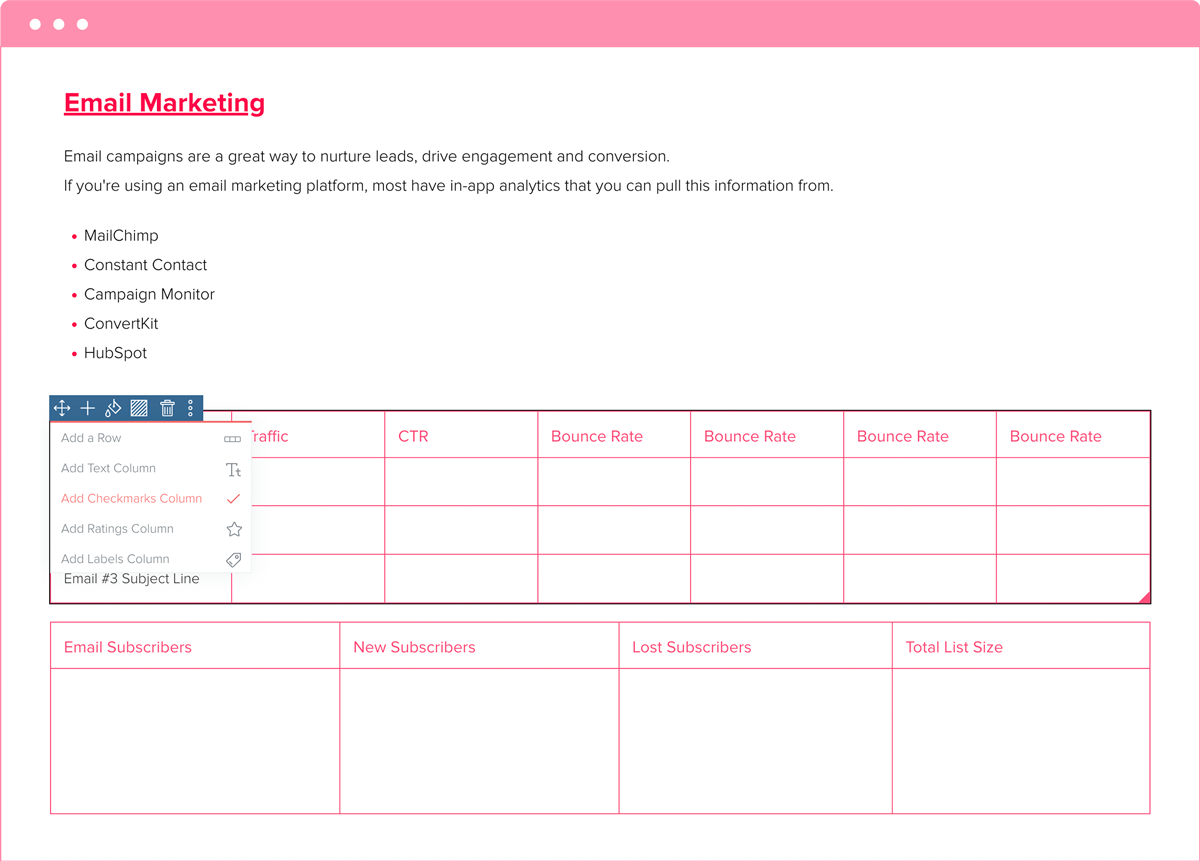
Pull email marketing data
Email campaigns are a great way to nurture leads, drive engagement and conversion.
If you’re using an email marketing platform, most have in-app analytics that you can pull this information from. These might include:
- MailChimp
- Constant Contact
- Campaign Monitor
- ConvertKit
- HubSpot
Use the table to take a deep dive into your email marketing campaigns, including the email subject, traffic from each particular email, CTR, open rate, unsubscribes, conversions and bounce rate. You can also outline the number of email subscribers, new, lost and total email list size in a secondary table.
Measure how much new interest you’re generating
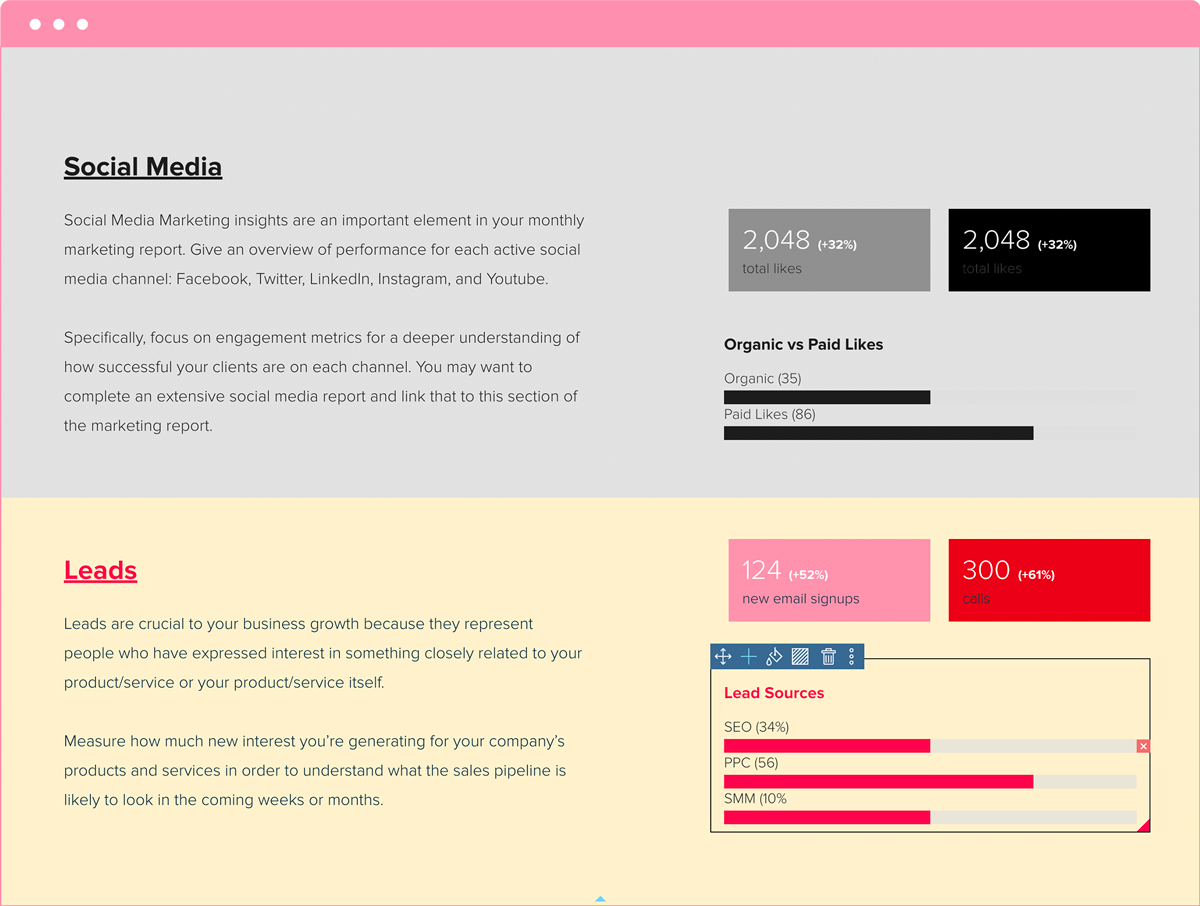
Leads are crucial to your business growth because they represent people who have expressed interest in something closely related to your product/service or your product/service itself.
Measure how much new interest you’re generating for your company’s products and services in order to understand what the sales pipeline is likely to look like in the coming weeks or months.
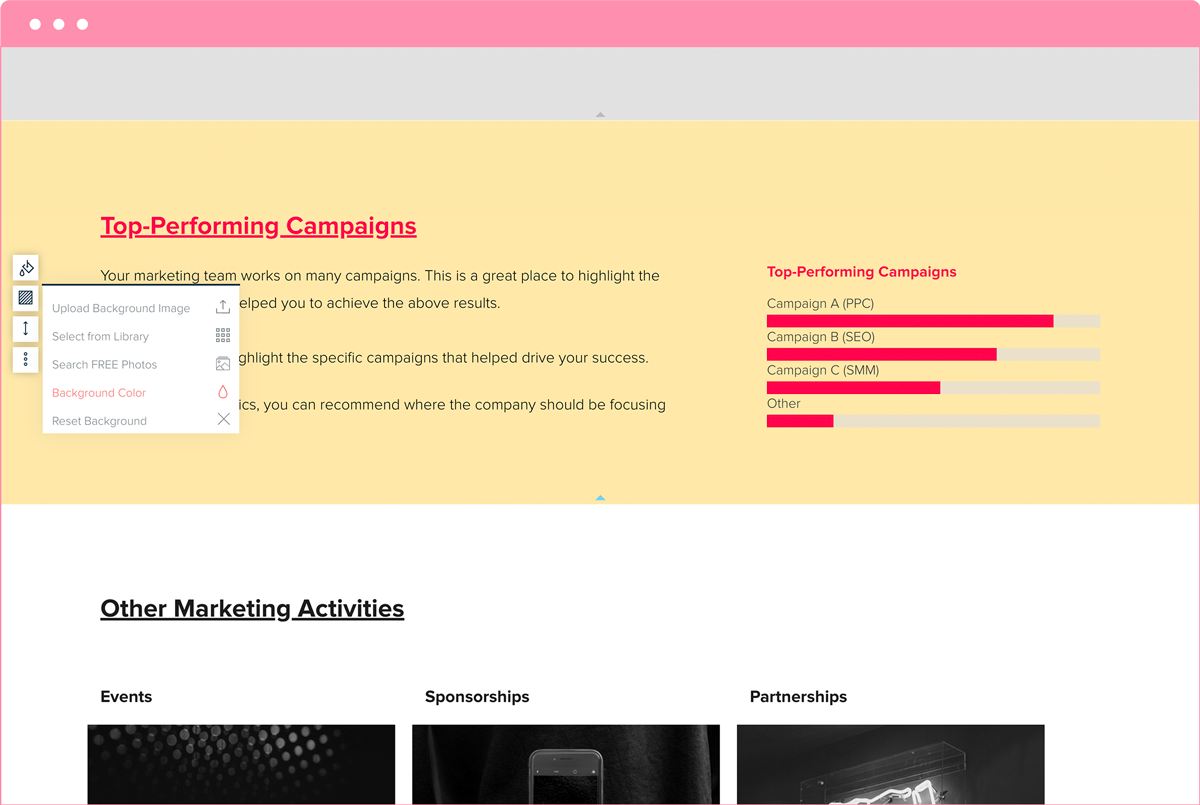
Highlight top-performing marketing campaigns and any other marketing activities
Your marketing team is involved in a number of campaigns. This is an excellent spot to highlight the most successful campaigns that helped you reach the goals listed above.
Use this section to highlight the specific campaigns that helped drive your success. Based on these metrics, you can recommend where the company should be focusing next month.
You can also mention other marketing initiatives your team’s worked on:
- List any events you hosted or attended this month. Did your team conduct any surveys, create any blog posts or other marketing material for the event?
- Did your company sponsor any groups, trade events or charity causes? How are your sponsorships affecting your marketing and sales efforts?
- Are there any partners you’re working with? How are you working together to promote each other’s brands?
Summarize key findings and what this means for your brand or marketing strategy
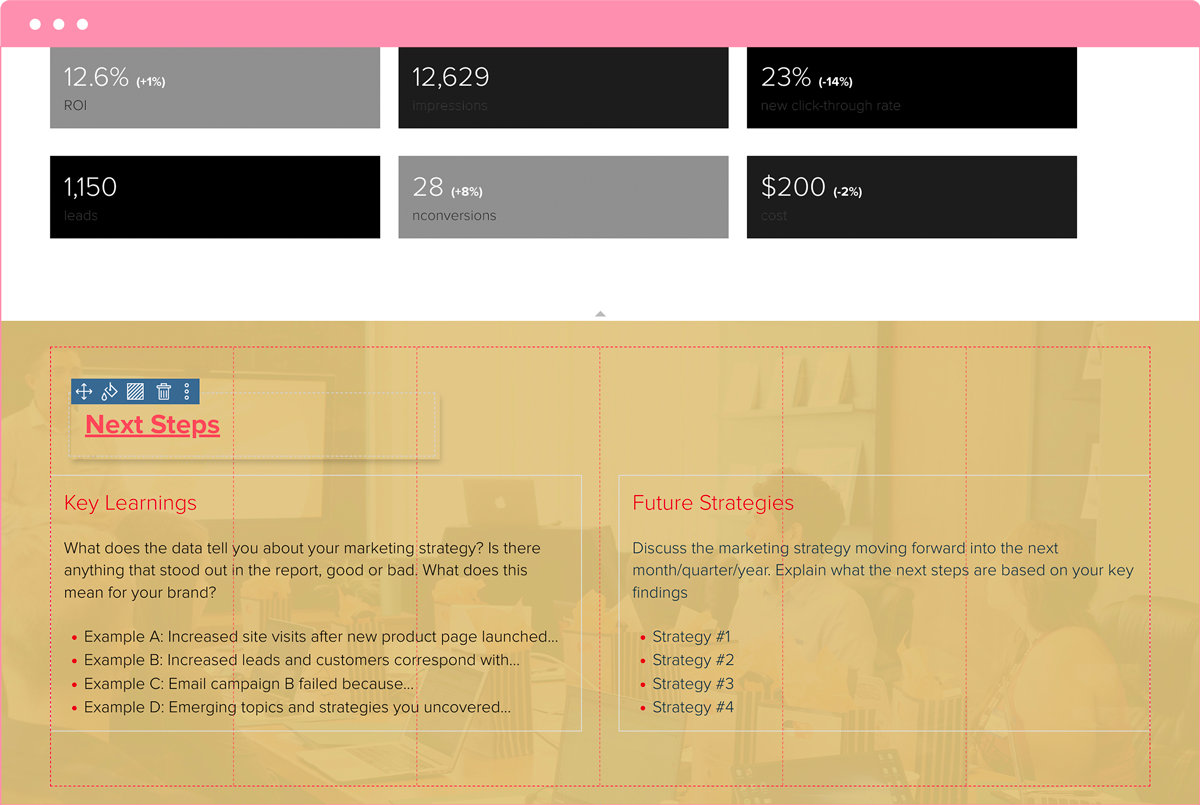
What does the data tell you about your marketing strategy? Is there anything that stood out in the report, good or bad? What does this mean for your brand?
- Example A: Increased site visits after new product page launched…
- Example B: Increased leads and customers correspond with…
- Example C: Email campaign B failed because…
- Example D: Emerging topics and strategies you uncovered…
Discuss the marketing strategy moving forward into the next month/quarter/year. Explain what the next steps are based on your key findings.

Teamspace for beautiful living documents.


246,768 users and counting…
Outline social media activity for each active channel
Social Media Marketing insights are an important element in your monthly marketing report. Give an overview of performance for each active social media channel: Facebook, Twitter, LinkedIn, Instagram, and Youtube.
Focus on engagement metrics in particular to get a better idea of how successful your clients are on each channel. You could also write a comprehensive social media report and connect it to this portion of the marketing report.